# 2D contour from .csv
**URL:** https://discourse.paraview.org/t/2d-contour-from-csv/2913
**Category:** ParaView Support
**Created:** [November 5, 2019, 4:36pm UTC](https://discourse.paraview.org/t/2d-contour-from-csv/2913 "2019-11-05T16:36:30Z")
**Posts on this page:** 7
**Page:** 1
### Author:  [@louisekh91](https://discourse.paraview.org/u/louisekh91)
#### Post date: [November 5, 2019, 4:36pm UTC](https://discourse.paraview.org/t/2d-contour-from-csv/2913/1 "2019-11-05T16:36:30Z")
Hello,
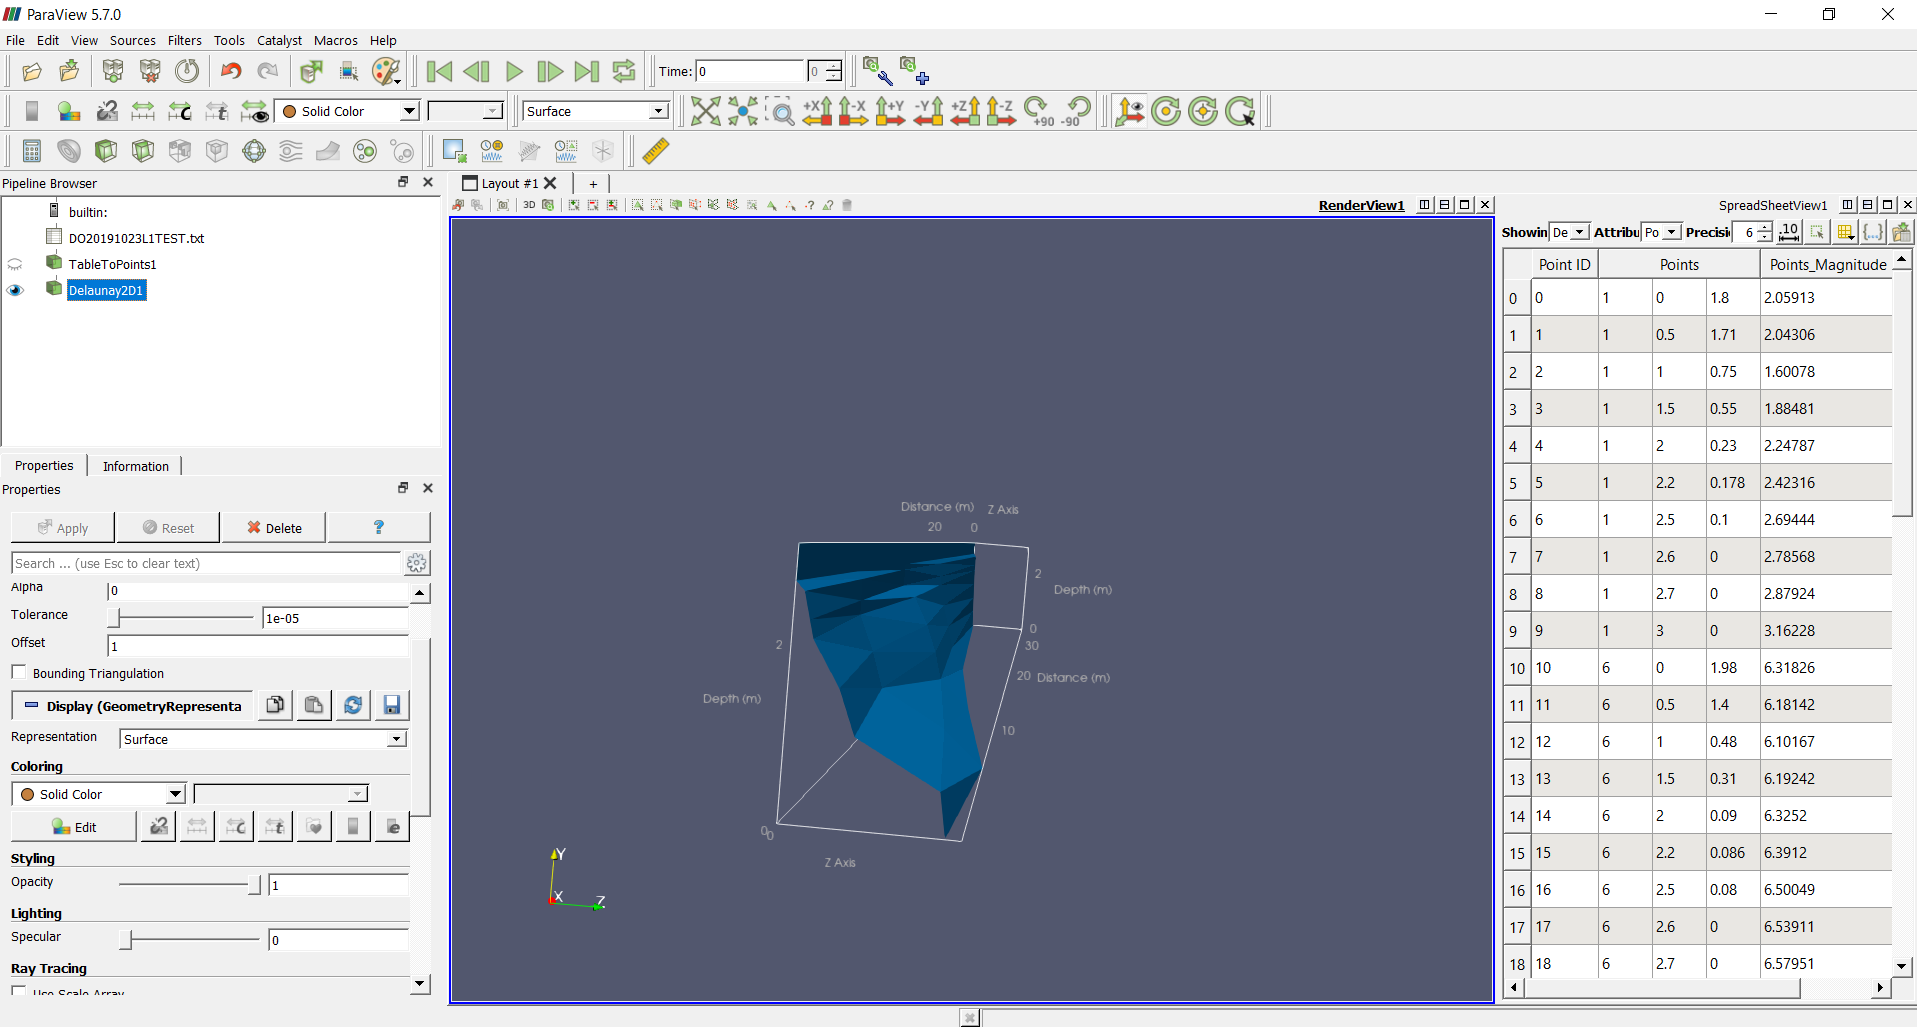
I am very new to the use of ParaView and have run into a problem. I am trying to do a simple rendering of a 2D plot (xy) with the z-values indicated by contours. I have the data in three columns (x, y and z) in a .csv file. I open the .csv file and use the filters “Table To Points” and “Delaunay 2D” as I have read suggestions for in previous similar topics ([https://public.kitware.com/pipermail/paraview/2013-September/029217.html](https://public.kitware.com/pipermail/paraview/2013-September/029217.html) and [https://public.kitware.com/pipermail/paraview/2012-May/024841.html](https://public.kitware.com/pipermail/paraview/2012-May/024841.html)) BUT after doing this, I am still not able to access the “Contour” filter as seen from the screenshot below. What am I missing?
Thanks,
Louise
---
### Author:  [@Kenneth\_Moreland](https://discourse.paraview.org/u/Kenneth_Moreland)
#### Post date: [November 6, 2019, 1:53am UTC](https://discourse.paraview.org/t/2d-contour-from-csv/2913/2 "2019-11-06T01:53:59Z")
I’m a little confused by what you mean by the contours you want to see and by “z-values indicated by contours.” Do you mean you want to see contours like you see on a [topographic map](https://en.wikipedia.org/wiki/Topographic_map) with curves on a flat surface?
---
### Author:  [@louisekh91](https://discourse.paraview.org/u/louisekh91)
#### Post date: [November 6, 2019, 9:26am UTC](https://discourse.paraview.org/t/2d-contour-from-csv/2913/3 "2019-11-06T09:26:17Z")
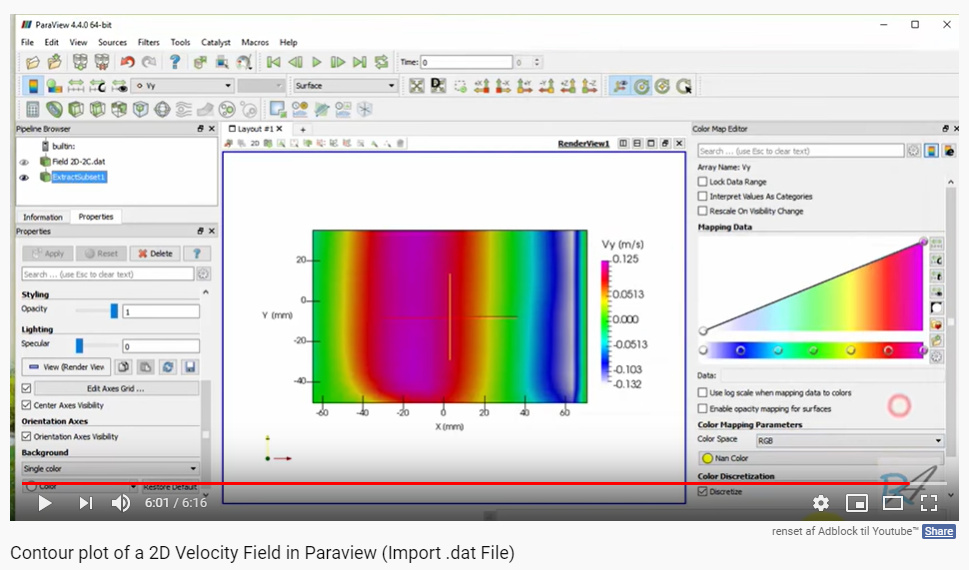
Yes something like contours on a topographic map - contours on a flat surface. Ideally I would like contour lines with different colours or maybe preferable with colour filling between the lines somewhat like what’s in the screenshot below.
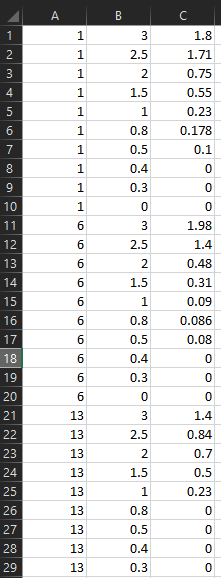
The x, y and z values I have are simply this (image below) - x in first column, y in second column and then I would like to have values of the third column represented by different colours like the image above or with contour lines / isosurfaces.
---
### Author:  [@Kenneth\_Moreland](https://discourse.paraview.org/u/Kenneth_Moreland)
#### Post date: [November 6, 2019, 2:50pm UTC](https://discourse.paraview.org/t/2d-contour-from-csv/2913/4 "2019-11-06T14:50:30Z")
OK. What you are describing is not actually contours but rather the coloring of a flat surface. So the first think you need to do is change how you are using `Table To Points` to generate a flat surface rather than the raised surface. (You are actually making a 3D surface plot, which is useful in its own right, but not what you are asking for.) To do this, turn on the `2D Points` option on the `Table To Points` filter. The `Z Column` options will then be ignored and all the points will be placed in the x-y plane, which is once you want.
Then when you run `Delaunay 2D` filter, you will get a flat surface. In the second toolbar you can then select your 3rd column of data for the coloring. From your spreadsheet screenshot, it looks like you have no headers, so I assume that the name of the data will be `Field 2`.
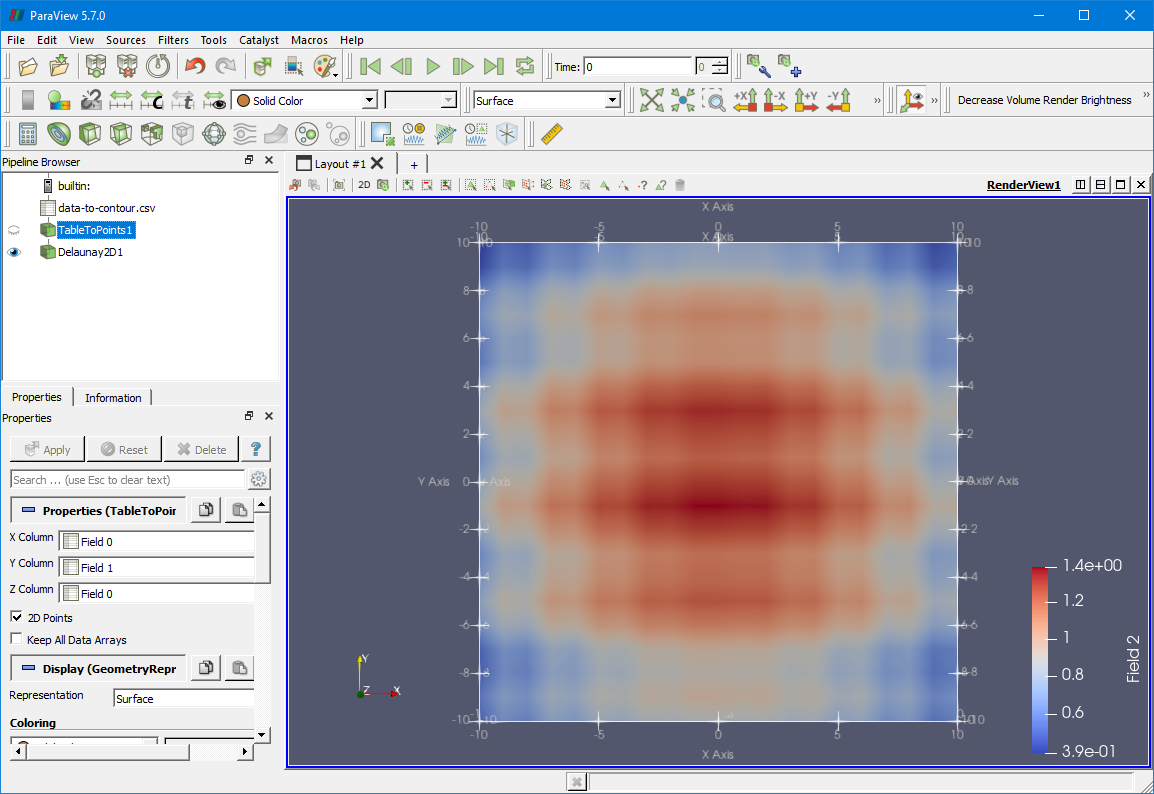
(Incidentally, I used the data from this csv file, which I generated, for this image: [data-to-contour.csv](https://discourse.paraview.org/uploads/short-url/r0HTbrOVaCxmk18WonXK8yESJXU.csv). Generally, it would have been better for you to post your csv file rather than a screenshot of some of the data. I would have created these examples with your data if you had done so.)
Getting back to actual contours, if you see contour lines in the video screenshot you posted, then they are caused by lines created by your visual system due to the uneven colors being chosen. I’m not a fan of those colors being used because of these weird effects that can happen in your visual system. Contours that you see could be argued as a happy accident, but if you really want to establish contours, it makes more sense to do so using more precise methods than visual artifacts from poorly chosen colors.
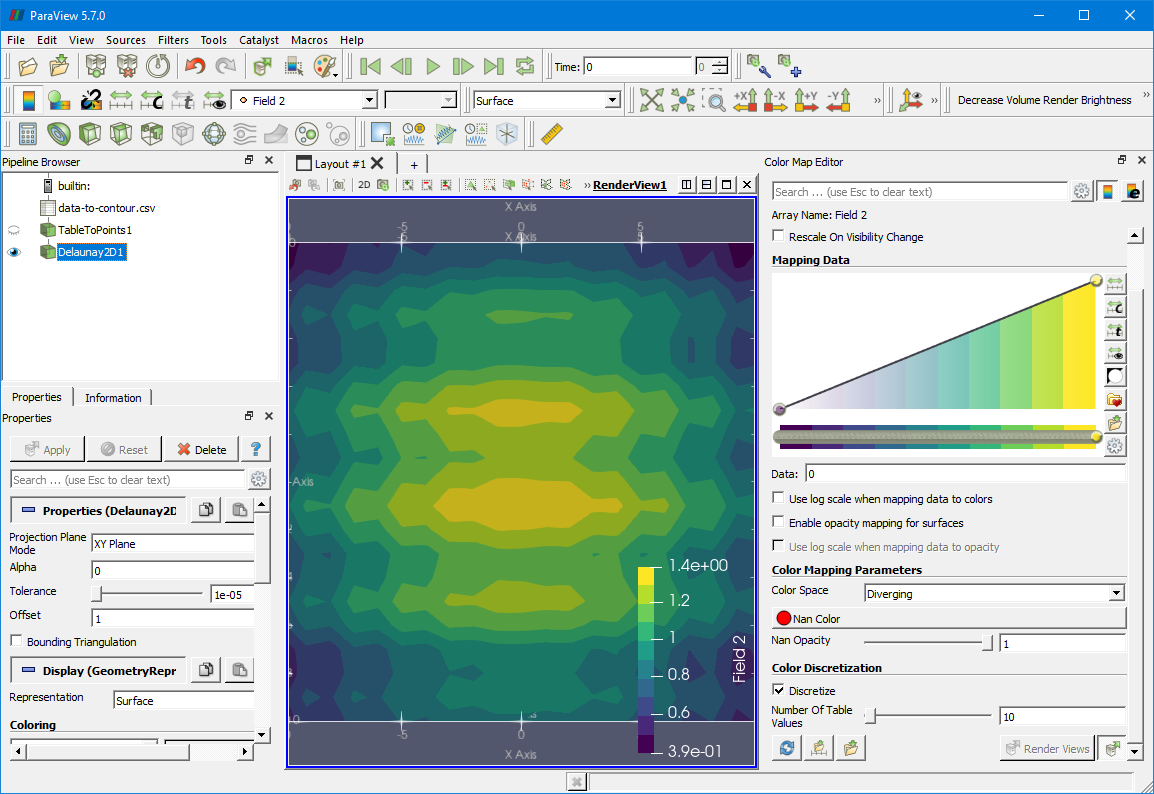
If you want to create contours using jumps in colors (which is a fine way to create a contour on a surface), then it can be done by creating a jump in the colors used in the color map. The easiest way to to create these jumps is to go to the color map editor  and use the `Descretize` option. This option is actually on by default but uses too many colors to differentiate (for technical reasons). Simply lower the `Number Of Table Values` to a smaller number (such as 10) so that you can see the transitions clearly. The screenshot below shows this. I also changed the colors used. The default colors are fine, but because you have a flat surface you don’t have to worry about shading and other maps give you more differences in colors. I’ve used the Viridis color map here, which is pretty popular. You can get to this and more by going to the color favorites  in the color map editor.
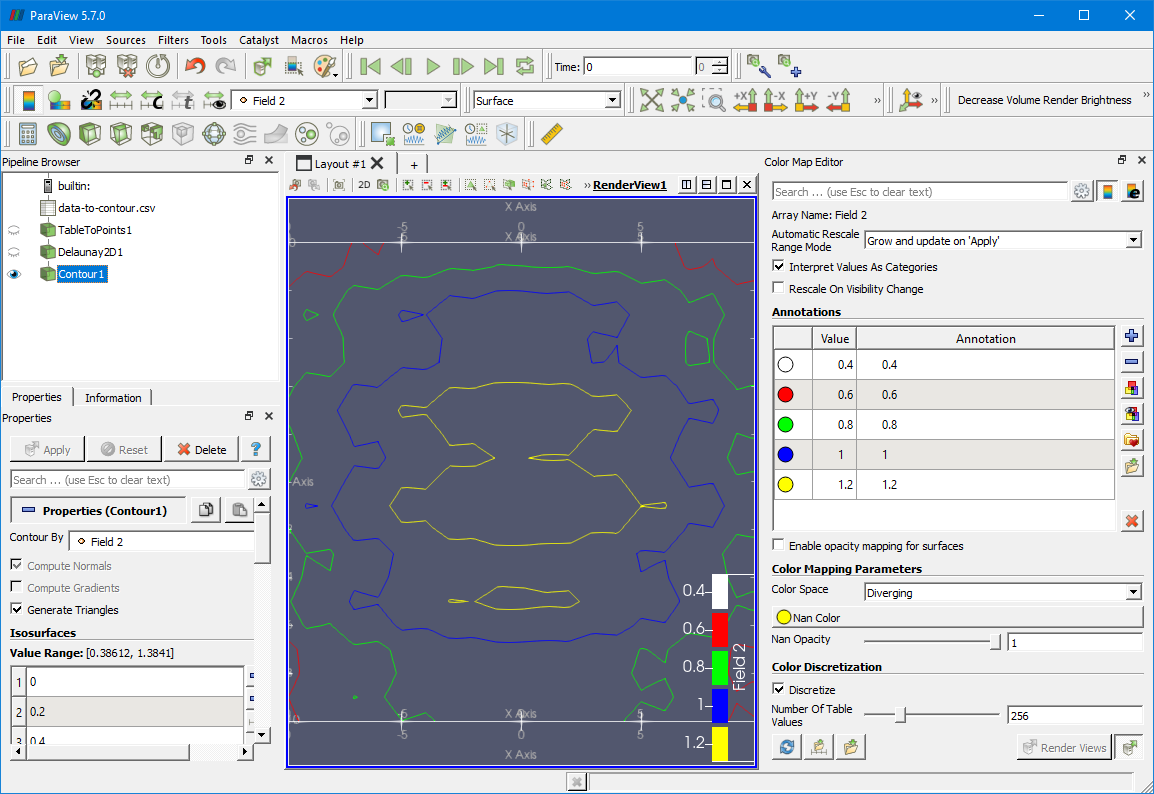
If you really want contours, as in extracting the curves in the surface representing specific values, you can do that too with the `Contour` filter as you were trying to earlier. The `Contour` filter should now be available as you now have a field on your data from which it can grab contours. In the screenshot below, I have done just that. I also changed the colors in the color map editor to `Interpret Values As Categories` so that you have a specific color for each contour.
---
### Author:  [@Qiao](https://discourse.paraview.org/u/Qiao)
#### Post date: [June 21, 2020, 11:24pm UTC](https://discourse.paraview.org/t/2d-contour-from-csv/2913/5 "2020-06-21T23:24:01Z")
Dear Kenneth, could you please help me to solve it? [2D contour from csv with values at array nodes](https://discourse.paraview.org/t/2d-contour-from-csv-with-values-at-array-nodes/4636)
Thank you so much.
---
### Author:  [@mwestphal](https://discourse.paraview.org/u/mwestphal)
#### Post date: [June 22, 2020, 7:54am UTC](https://discourse.paraview.org/t/2d-contour-from-csv/2913/6 "2020-06-22T07:54:38Z")
Please tag other users in your own topic when needed instead of necro bumping topics.
Thanks.
---
### Author:  [@mwestphal](https://discourse.paraview.org/u/mwestphal)
#### Post date: [June 22, 2020, 7:54am UTC](https://discourse.paraview.org/t/2d-contour-from-csv/2913/7 "2020-06-22T07:54:41Z")