# 2D velocity field analysis
**URL:** https://discourse.paraview.org/t/2d-velocity-field-analysis/10089
**Category:** ParaView Support
**Created:** [August 2, 2022, 7:59pm UTC](https://discourse.paraview.org/t/2d-velocity-field-analysis/10089 "2022-08-02T19:59:22Z")
**Posts on this page:** 3
**Page:** 1
### Author:  [@galex](https://discourse.paraview.org/u/galex)
#### Post date: [August 2, 2022, 7:59pm UTC](https://discourse.paraview.org/t/2d-velocity-field-analysis/10089/1 "2022-08-02T19:59:22Z")
Hello,
I am attempting to analyze a time series of .csv files. Each file corresponds to a time point. Within each file is X position, Y position, Velocity in X direction (u), Velocity in Y direction (v). The entire series of .csv files can be accessed here: [Box](https://wustl.box.com/s/g35zbl3d1msbeqga3ffhy1r12l77jnag)
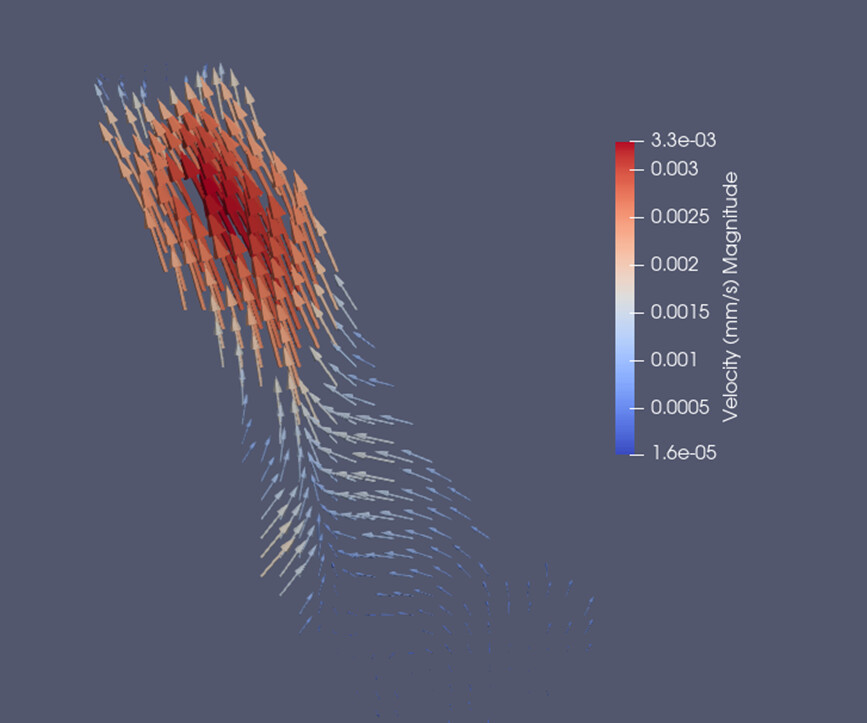
I have not used ParaView before but I have found so many helpful posts. However, detail was lacking so I decided to document my pipeline and ask how I can achieve my goal, which is to be able to select a region of the flow field and produce a Velocity (relative to flow direction) vs. Time plot. Here is what one flow field at one time point looks like:
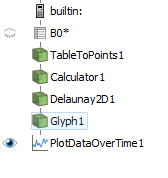
My pipeline is as follows:
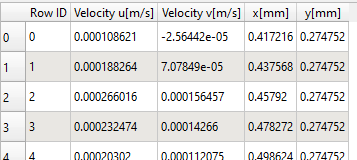
The raw .csv table looks like this (371 rows). After opening a .csv file, I learned I need to change my field delimiter to a semicolon. I am not sure about the other check boxes:
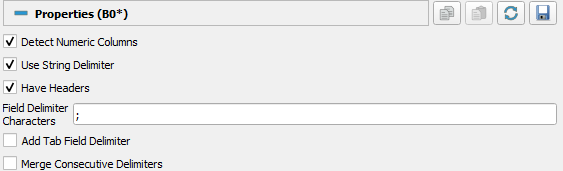
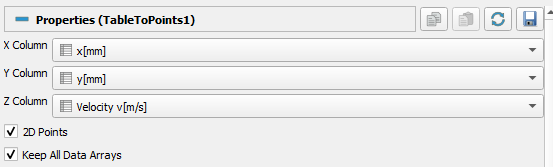
First, I convert the .csv data into point data using Table To Points filter. There is no Z dimension (2D points), so “Velocity v[m/s]” is just a place holder in this case. I selected “Keep All Data Arrays” because I need all 4 columns and I couldn’t select those I needed later on if I did not check this:
Now the new table looks like this:
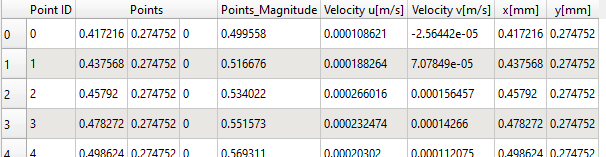
What is “Points\_Magnitude” and how is it useful?
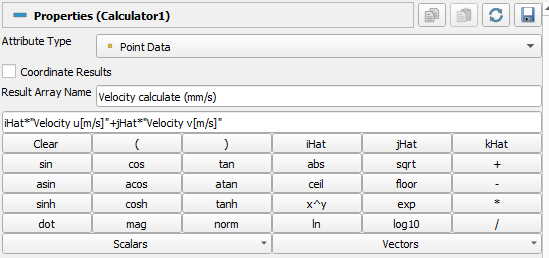
I know that I need to convert my 2 scalars (Velocity u and Velocity v) into a vector, which will result in 3 columns: X position, Y position, and the velocity vector. I use “Calculator” to multiply the scalars by iHat and jHat respectively (did I do this correctly?). I called the new values “Velocity calculate (mm/s)”:
Here is the resulting table:

And when I use the Plot Selection Over Time filter and select part of my vector field I get this plot:
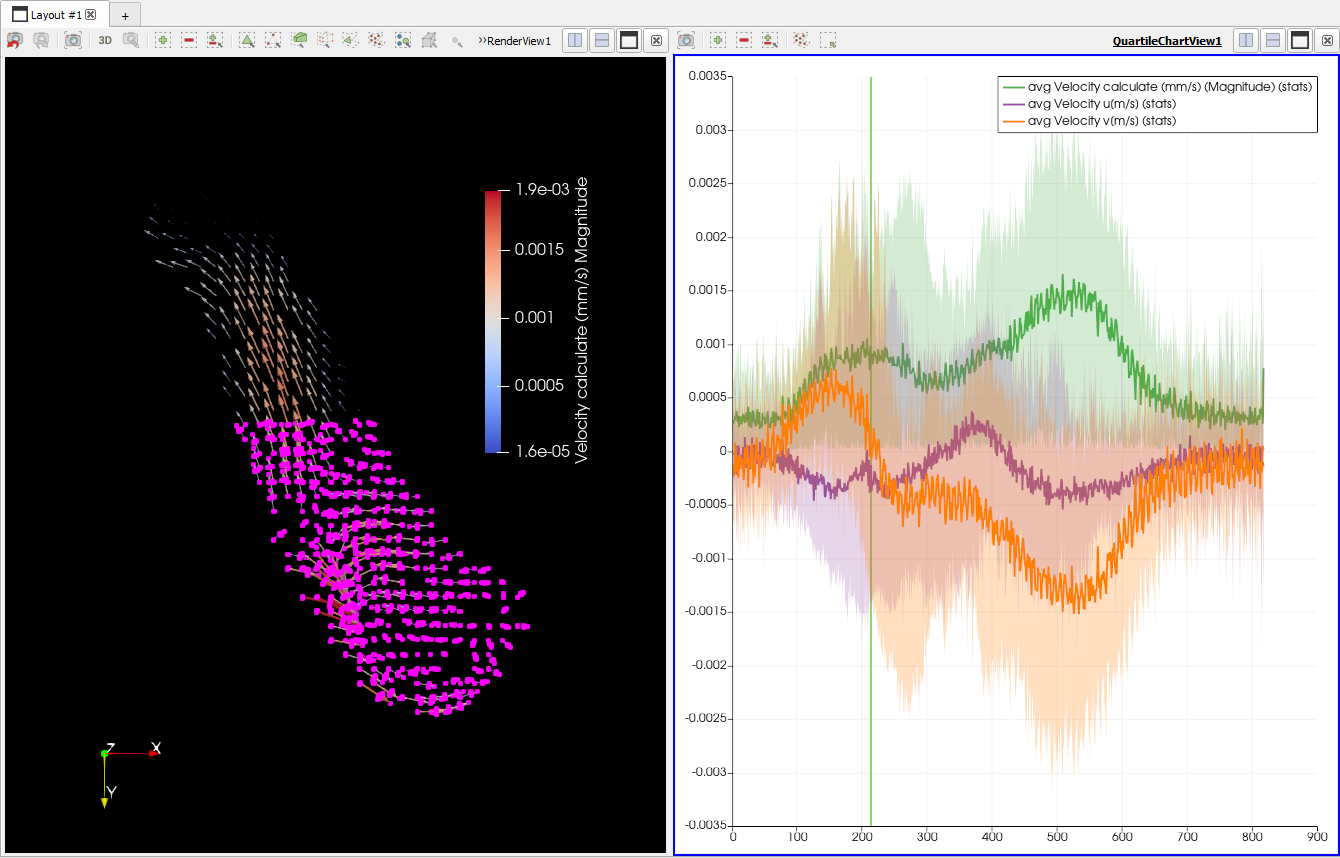
My problem is, I need to quantify velocity in the flow direction (bottom right to top left), so that I can plot negative velocity. I know I can plot over a line (but haven’t gotten that to work).
How do I 1) quantify negative velocity (relative to flow direction), 2) a specified region, and 3) over time?
Thank you for following along!
---
### Author:  [@Kenichiro-Yoshimi](https://discourse.paraview.org/u/Kenichiro-Yoshimi)
#### Post date: [August 3, 2022, 12:28am UTC](https://discourse.paraview.org/t/2d-velocity-field-analysis/10089/2 "2022-08-03T00:28:55Z")
Hello,
This is in response to the first question.
> 1. quantify negative velocity
The following steps are possible:
1. Create a direction vector field `dir` of length 1 using **Python Calculator** :
**Expression** : `np.array([-1/sqrt(2), -1/sqrt(2), 0])`
**Array Name** : `dir`
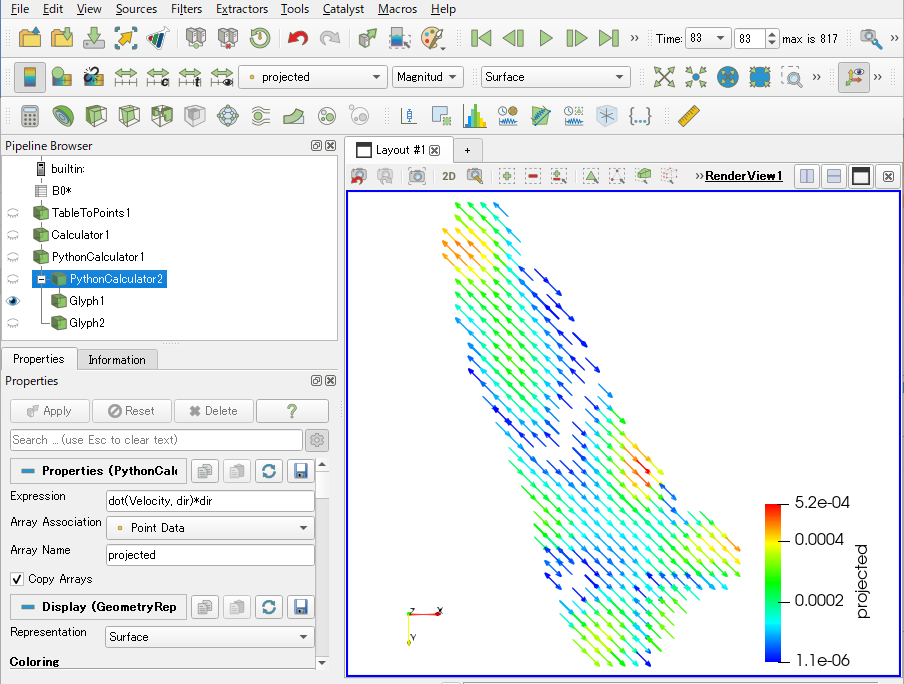
2. Project the velocity vector `Velocity` onto the direction vector `dir` using the **Python Calculator** :
**Expression** : `dot(Velocity, dir)*dir`
**Array Name** : `projected`
The result of projecting the velocity vectors is shown in the figure below. These vectors may be quantified by statistical processing.
---
### Author:  [@Francois\_Mazen](https://discourse.paraview.org/u/Francois_Mazen)
#### Post date: [August 4, 2022, 6:16am UTC](https://discourse.paraview.org/t/2d-velocity-field-analysis/10089/3 "2022-08-04T06:16:53Z")
> [@galex](#):
>
> What is “Points\_Magnitude” and how is it useful?
This is the length (or norm) of the vector between the origin and the point. If I understand correctly, this is not relevant in your case.