# 3-D Scaling representation
**URL:** https://discourse.paraview.org/t/3-d-scaling-representation/8018
**Category:** Feature Requests
**Created:** [September 17, 2021, 8:14am UTC](https://discourse.paraview.org/t/3-d-scaling-representation/8018 "2021-09-17T08:14:56Z")
**Posts on this page:** 8
**Page:** 1
### Author:  [@woodscn](https://discourse.paraview.org/u/woodscn)
#### Post date: [September 17, 2021, 8:14am UTC](https://discourse.paraview.org/t/3-d-scaling-representation/8018/1 "2021-09-17T08:14:56Z")
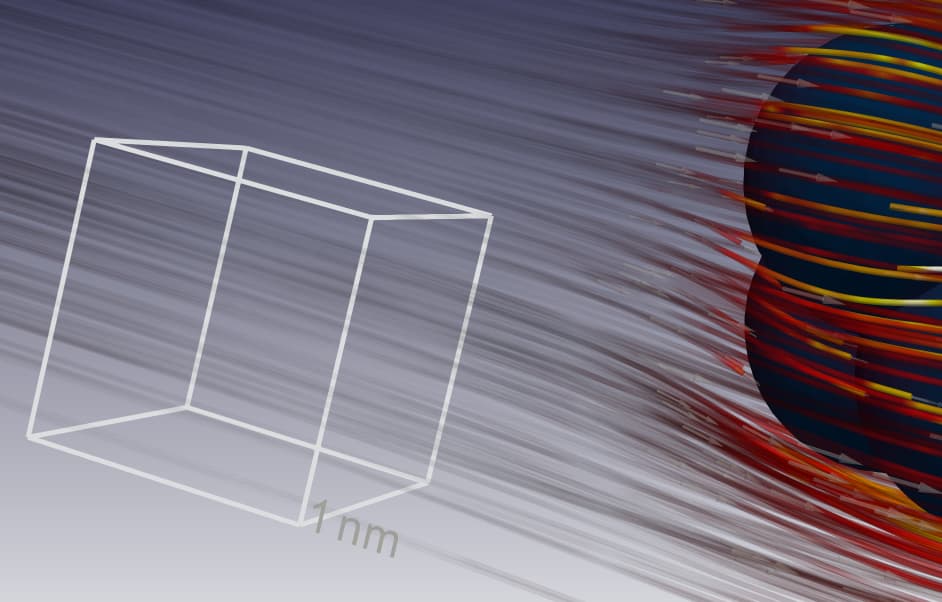
It would be very convenient to add a new Measurement source to represent a 3-D scaling object that could be embedded into the rendering. I was able to mock up something that almost works using the Fast Uniform Grid and 3D Text sources, but I think that lighting might be handled differently between the wireframe representation of the grid and the 3D text. I’m imagining a wireframe cube with the standard transformation controls, with one or more attached text labels.
I can already imagine some potential challenges, but I think it would make it much easier to provide appropriate spatial context, especially in cases where that’s not obvious. The exaggerated height of terrain in Antarctica might also benefit. @patchett2002
---
### Author:  [@mwestphal](https://discourse.paraview.org/u/mwestphal)
#### Post date: [September 17, 2021, 8:16am UTC](https://discourse.paraview.org/t/3-d-scaling-representation/8018/2 "2021-09-17T08:16:29Z")
What does this gives you compared to the ruler ?
Btw there is no concept of unit in VTK or ParaView
---
### Author:  [@woodscn](https://discourse.paraview.org/u/woodscn)
#### Post date: [September 17, 2021, 3:21pm UTC](https://discourse.paraview.org/t/3-d-scaling-representation/8018/3 "2021-09-17T15:21:27Z")
Essentially, it’s a 3D ruler. To my mind, it gives two new things. One, it directly shows the effects of parallax, giving users a more quantitative idea of how things are shrinking into the distance. Two, it would simplify the process for showing different scales in different dimensions, if one is exaggerated with respect to the others (height in terrain data is a common example).
---
### Author:  [@wascott](https://discourse.paraview.org/u/wascott)
#### Post date: [September 17, 2021, 5:01pm UTC](https://discourse.paraview.org/t/3-d-scaling-representation/8018/4 "2021-09-17T17:01:07Z")
Hey Nathan,
I think what you are describing mostly already exists. It is the Axis Grid and the Data Axis Grid. Have you tried these? Are you looking for something different?
I do admit I see a use for your unit cube.
Also, as Mathiew mentioned, you could have a side of “1”, but not “1 nm”, as ParaView doesn’t have units.
---
### Author:  [@woodscn](https://discourse.paraview.org/u/woodscn)
#### Post date: [September 17, 2021, 5:25pm UTC](https://discourse.paraview.org/t/3-d-scaling-representation/8018/5 "2021-09-17T17:25:09Z")
The Axis Grid and Data Axis Grid are both very useful, and I did use them both in the development of this image. Unfortunately, they lose their value quickly as you zoom in to particular features (as I’ve done above), because you can only see pieces of the grids they create (if that).
I’m not worried about the units. A user-fillable text field would be fine, since they may well not want to do “1”, either.
---
### Author:  [@mwestphal](https://discourse.paraview.org/u/mwestphal)
#### Post date: [September 20, 2021, 7:45am UTC](https://discourse.paraview.org/t/3-d-scaling-representation/8018/6 "2021-09-20T07:45:00Z")
I could imagine a three axis extension to the current ruler
---
### Author:  [@cory.quammen](https://discourse.paraview.org/u/cory.quammen)
#### Post date: [September 20, 2021, 10:53am UTC](https://discourse.paraview.org/t/3-d-scaling-representation/8018/7 "2021-09-20T10:53:01Z")
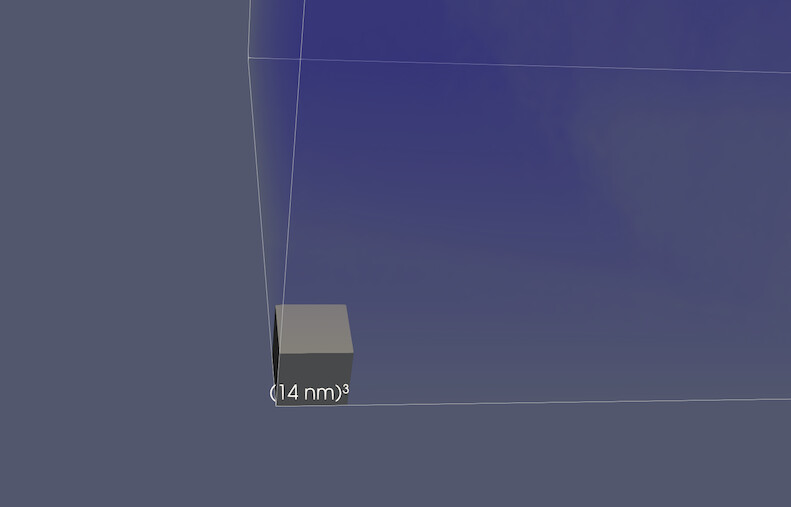
VTK has a 3-axis [measurement cube](https://vtk.org/doc/nightly/html/classvtkMeasurementCubeHandleRepresentation3D.html) that cold potentially be used.
Here it is in use in tomviz.
---
### Author:  [@woodscn](https://discourse.paraview.org/u/woodscn)
#### Post date: [September 20, 2021, 2:40pm UTC](https://discourse.paraview.org/t/3-d-scaling-representation/8018/8 "2021-09-20T14:40:23Z")
I think that whatever we come up with needs to have a wire-frame like representation, in order to hide less of the data. Unfortunately, as far as I was able to find, that’s not possible to do right now. The closest I got is what’s in my example, but the text and the wireframe are supposed to be the same color.