# A quick question about plotting points (x, y, z, time)
**URL:** https://discourse.paraview.org/t/a-quick-question-about-plotting-points-x-y-z-time/4945
**Category:** ParaView Support
**Created:** [July 24, 2020, 6:32am UTC](https://discourse.paraview.org/t/a-quick-question-about-plotting-points-x-y-z-time/4945 "2020-07-24T06:32:32Z")
**Posts on this page:** 14
**Page:** 1
### Author:  [@Sungho\_Lee](https://discourse.paraview.org/u/Sungho_Lee)
#### Post date: [July 24, 2020, 6:32am UTC](https://discourse.paraview.org/t/a-quick-question-about-plotting-points-x-y-z-time/4945/1 "2020-07-24T06:32:32Z")
Hello.
I am a beginner of Paraview.
I have a point data set which has spatial and temporal information.
I plotted all points without the time stamp.
I’d like to plot the time evolution of scatters.
I don’t know how to write the data set into vtk including time.
I am looking forward to any comments.
Thanks
Sungho Lee
---
### Author:  [@mwestphal](https://discourse.paraview.org/u/mwestphal)
#### Post date: [July 24, 2020, 7:43am UTC](https://discourse.paraview.org/t/a-quick-question-about-plotting-points-x-y-z-time/4945/2 "2020-07-24T07:43:02Z")
You can write one file by timestep and name it like this :
```
file_0.ext
file_1.ext
file_2.ext
...
```
Then open the file series in ParaView.
---
### Author:  [@Sungho\_Lee](https://discourse.paraview.org/u/Sungho_Lee)
#### Post date: [July 24, 2020, 8:53am UTC](https://discourse.paraview.org/t/a-quick-question-about-plotting-points-x-y-z-time/4945/3 "2020-07-24T08:53:53Z")
Thanks you so much
It works well 🙂
Sungho
---
### Author:  [@logmclassrulit](https://discourse.paraview.org/u/logmclassrulit)
#### Post date: [August 29, 2022, 12:53pm UTC](https://discourse.paraview.org/t/a-quick-question-about-plotting-points-x-y-z-time/4945/5 "2022-08-29T12:53:33Z")
Hello. In what format are you writing the time to your file?
---
### Author:  [@mwestphal](https://discourse.paraview.org/u/mwestphal)
#### Post date: [August 29, 2022, 1:33pm UTC](https://discourse.paraview.org/t/a-quick-question-about-plotting-points-x-y-z-time/4945/6 "2022-08-29T13:33:44Z")
you do not write the time.
---
### Author:  [@logmclassrulit](https://discourse.paraview.org/u/logmclassrulit)
#### Post date: [August 29, 2022, 1:40pm UTC](https://discourse.paraview.org/t/a-quick-question-about-plotting-points-x-y-z-time/4945/7 "2022-08-29T13:40:45Z")
I want to do something like this [youtu.be/Asw4usQCqs0?t=183](http://youtu.be/Asw4usQCqs0?t=183) - visualization of points in time. I loaded the points using the TablesToPoints filter, but I don’t know how to make the points appear in time. Do you know any way?
---
### Author:  [@mwestphal](https://discourse.paraview.org/u/mwestphal)
#### Post date: [August 29, 2022, 2:51pm UTC](https://discourse.paraview.org/t/a-quick-question-about-plotting-points-x-y-z-time/4945/8 "2022-08-29T14:51:20Z")
please share your data
---
### Author:  [@logmclassrulit](https://discourse.paraview.org/u/logmclassrulit)
#### Post date: [August 31, 2022, 5:23am UTC](https://discourse.paraview.org/t/a-quick-question-about-plotting-points-x-y-z-time/4945/9 "2022-08-31T05:23:39Z")
[EVENTS.csv](https://discourse.paraview.org/uploads/short-url/90uRvTiGNcCCUc0ckvqU5I7qveB.csv) (19.0 KB)
---
### Author:  [@mwestphal](https://discourse.paraview.org/u/mwestphal)
#### Post date: [August 31, 2022, 5:41am UTC](https://discourse.paraview.org/t/a-quick-question-about-plotting-points-x-y-z-time/4945/10 "2022-08-31T05:41:37Z")
There is no easy way, you basically need to write your own programmable filter that will extract the data and timesteps and convert it to an actual temporal dataset.
---
### Author:  [@logmclassrulit](https://discourse.paraview.org/u/logmclassrulit)
#### Post date: [August 31, 2022, 10:29am UTC](https://discourse.paraview.org/t/a-quick-question-about-plotting-points-x-y-z-time/4945/11 "2022-08-31T10:29:10Z")
Mathieu, maybe you have some example of a programmable filter with animation?
---
### Author:  [@mwestphal](https://discourse.paraview.org/u/mwestphal)
#### Post date: [September 1, 2022, 5:59am UTC](https://discourse.paraview.org/t/a-quick-question-about-plotting-points-x-y-z-time/4945/12 "2022-09-01T05:59:55Z")
Here is one, this is not trivial though:
[https://public.kitware.com/pipermail/paraview/2018-February/041970.html](https://public.kitware.com/pipermail/paraview/2018-February/041970.html)
---
### Author:  [@logmclassrulit](https://discourse.paraview.org/u/logmclassrulit)
#### Post date: [September 1, 2022, 6:23am UTC](https://discourse.paraview.org/t/a-quick-question-about-plotting-points-x-y-z-time/4945/13 "2022-09-01T06:23:44Z")
Thank you!
---
### Author:  [@Kenichiro-Yoshimi](https://discourse.paraview.org/u/Kenichiro-Yoshimi)
#### Post date: [September 1, 2022, 2:18pm UTC](https://discourse.paraview.org/t/a-quick-question-about-plotting-points-x-y-z-time/4945/14 "2022-09-01T14:18:36Z")
Hi @logmclassrulit,
There would be a way to use an existing plugin.
[PythonAlgorithmExamples](https://gitlab.kitware.com/paraview/paraview/-/blob/master/Examples/Plugins/PythonAlgorithm/PythonAlgorithmExamples.py)
This plugin reads a CSV file as time series data if it contains a ‘time’ column.
But before that, you need to add the ‘time’ column to the EVENTS.csv using the trivial python script `add_time_col.py` ([add\_time\_col.py](https://discourse.paraview.org/uploads/short-url/uRrAPmkle6VOAJfAh2kamNpswKP.py) (1.3 KB)). The run command is below:
> python add\_time\_col.py
Then `EVENTS_out.csv` will be output.
[EVENTS\_out.csv](https://discourse.paraview.org/uploads/short-url/iN2tVcDnEKxqdgQfKJ5YI62z53l.csv) (21.8 KB)
However, for your purposes, this plugin ‘PythonAlgorithmExamples’ could not be used as is, and the following changes were necessary:
- Modified to read string arrays
- Modified to read all points before the current time
The modified is as below.
[PythonAlgorithmExamples.py](https://discourse.paraview.org/uploads/short-url/1JGzxO2HVBEavE3vB9avNXaHfcl.py) (14.6 KB)
Now load this modified plugin into ParaView.
`Tools > Make Plugins...`
Then load it via the `Load New ...` button.
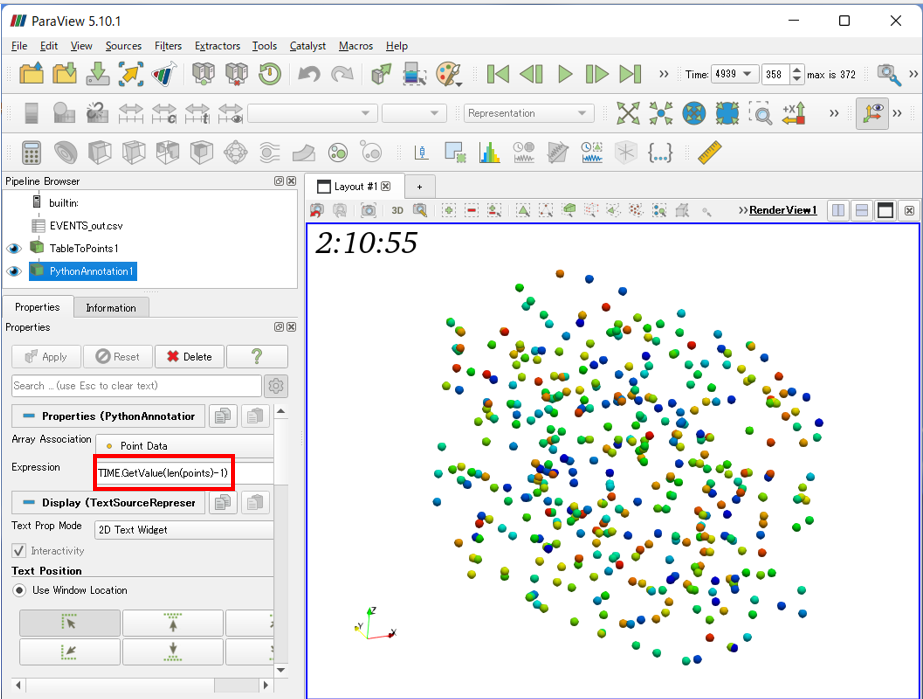
Next, `EVENTS_out.csv` is read by specifying the plugin reader **Python-based CSV Reader**. When loaded, the data is read into the `Spread Sheet` as a table, which is then converted to points using the **Table To Point** filter.
Finally, you may want to use the **Python Annotation** filter to display the time in the TIME column. Here, `Expression` is described as follows:
`Expression: TIME.GetValue(len(points)-1)`
---
### Author:  [@logmclassrulit](https://discourse.paraview.org/u/logmclassrulit)
#### Post date: [September 1, 2022, 4:06pm UTC](https://discourse.paraview.org/t/a-quick-question-about-plotting-points-x-y-z-time/4945/15 "2022-09-01T16:06:47Z")
Wow, this is amazing and you are amazing, thank you very much 🤗