# Assigning non-constant longitude/latitude to a mesh
**URL:** https://discourse.paraview.org/t/assigning-non-constant-longitude-latitude-to-a-mesh/9348
**Category:** ParaView Support
**Created:** [April 4, 2022, 2:17pm UTC](https://discourse.paraview.org/t/assigning-non-constant-longitude-latitude-to-a-mesh/9348 "2022-04-04T14:17:59Z")
**Posts on this page:** 4
**Page:** 1
### Author:  [@jbbarre](https://discourse.paraview.org/u/jbbarre)
#### Post date: [April 4, 2022, 2:17pm UTC](https://discourse.paraview.org/t/assigning-non-constant-longitude-latitude-to-a-mesh/9348/1 "2022-04-04T14:17:59Z")
Hello,
I want to display the mesh used in a numerical simulation (Nemo ocean model). The model has 803\*803 cells with coordinates defined by longitude and latitude. Each cell has a specific size, which means that the grid is not constant. This data is coming from a [netcdf file](https://drive.google.com/file/d/14SgWVRjngx-Xa2pUzmK4IoYsJRxOuiny/view?usp=sharing) whith the following structure:
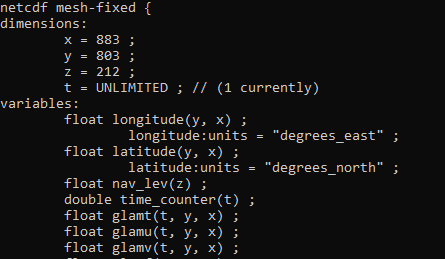
According the configuration of the mesh, longitude and latitude are not defined as dimensions in the netcdf file. I understood that praview can’t recognize them as coordinates. So, It took the cells indices as coordinates. I can’t find a Paraview’s solution to modify the mesh and assign the longitude/latitude coordinates to the corresponding cells. Is there any solution to this in Paraview or do I have to pre-process the file first ?
Any suggestions will be welcome.
jb
---
### Author:  [@\_Marco](https://discourse.paraview.org/u/_Marco)
#### Post date: [June 3, 2022, 1:35pm UTC](https://discourse.paraview.org/t/assigning-non-constant-longitude-latitude-to-a-mesh/9348/2 "2022-06-03T13:35:43Z")
Hi.
I came across a similar problem. I used xesmf regridding package. Then, using xarray (assign\_coords()) I reassigned the new coordinates and it now works.
The links:
[https://xesmf.readthedocs.io/en/latest/notebooks/Curvilinear\_grid.html](https://xesmf.readthedocs.io/en/latest/notebooks/Curvilinear_grid.html)
> **[xarray: N-D labeled arrays and datasets in Python](https://docs.xarray.dev/en/stable/)**
>
> xarray(formerly xray) is an open source project and Python package that makes working with labelled multi-dimensional arrays simple, efficient, and fun! Xarray introduces labels in the form of dime...
Happy coding.
Marco
---
### Author:  [@jbbarre](https://discourse.paraview.org/u/jbbarre)
#### Post date: [June 7, 2022, 7:45am UTC](https://discourse.paraview.org/t/assigning-non-constant-longitude-latitude-to-a-mesh/9348/3 "2022-06-07T07:45:47Z")
Hi Marco,
Thanks for your reply.
Since then, I also check the compatibilty of my netcdf file with the NetCDF Climate and Forecast (CF) Metadata Conventions. In my case, it appears that the lon/lat dimensions were not correctly defined with respect to the [convention](http://cfconventions.org/Data/cf-conventions/cf-conventions-1.7/cf-conventions.html#latitude-coordinate). I managed the modifications of the header using NCO tools (ncatted).
---
### Author:  [@\_Marco](https://discourse.paraview.org/u/_Marco)
#### Post date: [June 7, 2022, 8:23am UTC](https://discourse.paraview.org/t/assigning-non-constant-longitude-latitude-to-a-mesh/9348/4 "2022-06-07T08:23:19Z")
Great. The data I am working with (WRF model) are not CF compliant at all, so I had to do some twitching. If you happen working with the same data, another great, open source, visualization tool is VAPOR developed by NCAR.
Bye Bye