# Associating Time to Data in order to Animate
**URL:** https://discourse.paraview.org/t/associating-time-to-data-in-order-to-animate/2231
**Category:** ParaView Support
**Created:** [July 16, 2019, 1:42pm UTC](https://discourse.paraview.org/t/associating-time-to-data-in-order-to-animate/2231 "2019-07-16T13:42:39Z")
**Posts on this page:** 20
**Page:** 1
### Author:  [@Raychel\_Bahnick](https://discourse.paraview.org/u/Raychel_Bahnick)
#### Post date: [July 16, 2019, 1:42pm UTC](https://discourse.paraview.org/t/associating-time-to-data-in-order-to-animate/2231/1 "2019-07-16T13:42:39Z")
I have about 400 velocity values that are associated with time that are for a 2D point and I have several hundred 2D points. Is there a way to associate these 400 values for each point in Paraview and then have them animated with time?
Thank you for your help.
---
### Author:  [@cory.quammen](https://discourse.paraview.org/u/cory.quammen)
#### Post date: [July 16, 2019, 3:20pm UTC](https://discourse.paraview.org/t/associating-time-to-data-in-order-to-animate/2231/2 "2019-07-16T15:20:47Z")
Yes. Usually, time series are defined in a series of files, and each file corresponds to a single time. So, you could write out a series of 400 VTK files. Each file will have the points as well as the velocity associated with each point at that time.
---
### Author:  [@Raychel\_Bahnick](https://discourse.paraview.org/u/Raychel_Bahnick)
#### Post date: [July 16, 2019, 8:38pm UTC](https://discourse.paraview.org/t/associating-time-to-data-in-order-to-animate/2231/3 "2019-07-16T20:38:49Z")
Thank you for the advice. Each point has the 400 velocity points (the velocity is the third column in the data below). So I would need to take one line from each point’s file for each point in time and make 400 new VTK files. The data below is a .dat file. Do have any suggestions as to the best way to make the 400 vtk files?
1 00000011 0.1660 -0.0050 -0.0100 -0.0060 20 34 23 27 3.1 8.4 5.7 7.8 47 80 55 55
2 00000011 0.1640 0.0180 -0.0090 -0.0150 25 39 30 31 5.0 9.5 8.0 9.0 57 84 73 63
3 00000011 0.1520 -0.0010 -0.0070 -0.0090 27 27 25 40 5.7 6.3 6.4 11.2 75 59 63 86
4 00000011 0.1800 -0.0170 -0.0030 -0.0010 21 34 22 28 3.5 8.4 5.3 8.1 56 77 53 60
5 00000011 0.1680 -0.0130 -0.0050 -0.0050 27 34 30 32 5.7 8.4 8.0 9.3 68 76 67 66
6 00000011 0.1600 -0.0130 -0.0090 -0.0070 26 36 31 34 5.4 8.8 8.2 9.8 72 83 75 76
…
Thank you again
---
### Author:  [@cory.quammen](https://discourse.paraview.org/u/cory.quammen)
#### Post date: [July 17, 2019, 2:13am UTC](https://discourse.paraview.org/t/associating-time-to-data-in-order-to-animate/2231/4 "2019-07-17T02:13:29Z")
Yes, that sounds like it should work.
I would probably do this with a Python script (or whatever programming language you are comfortable with) and consult the [VTK File Formats](https://vtk.org/wp-content/uploads/2015/04/file-formats.pdf) document to see how to write a VTK legacy file. The dataset type you will want is polydata, described on page 4.
---
### Author:  [@Raychel\_Bahnick](https://discourse.paraview.org/u/Raychel_Bahnick)
#### Post date: [July 19, 2019, 1:11pm UTC](https://discourse.paraview.org/t/associating-time-to-data-in-order-to-animate/2231/5 "2019-07-19T13:11:15Z")
Great, I wrote a Python script and have all the vtk files inputted and it is working well. The Stream Tracer filter is not able to be applied to this group of vtks. Is there a way to apply the stream Tracer to a vtk file? If not, what file type would you suggest I convert my data to?
Thank you
---
### Author:  [@cory.quammen](https://discourse.paraview.org/u/cory.quammen)
#### Post date: [July 19, 2019, 1:51pm UTC](https://discourse.paraview.org/t/associating-time-to-data-in-order-to-animate/2231/6 "2019-07-19T13:51:16Z")
My understanding was that you had a set of points (you didn’t describe how they were organized, if at all) and that the velocity changes at these points. The **Stream Tracer** requires a volumetric dataset (or surface in a special case) and computes streamlines by integrating over a velocity field defined within that volume.
Are the points in your data set supposed to move according to the velocity at each time step? In that case, I don’t know of a filter that would move them over time.
A picture of your data (hand drawn is fine), and a picture of the kind of visualization you are expecting to produce is always helpful.
---
### Author:  [@Raychel\_Bahnick](https://discourse.paraview.org/u/Raychel_Bahnick)
#### Post date: [July 19, 2019, 4:05pm UTC](https://discourse.paraview.org/t/associating-time-to-data-in-order-to-animate/2231/7 "2019-07-19T16:05:36Z")
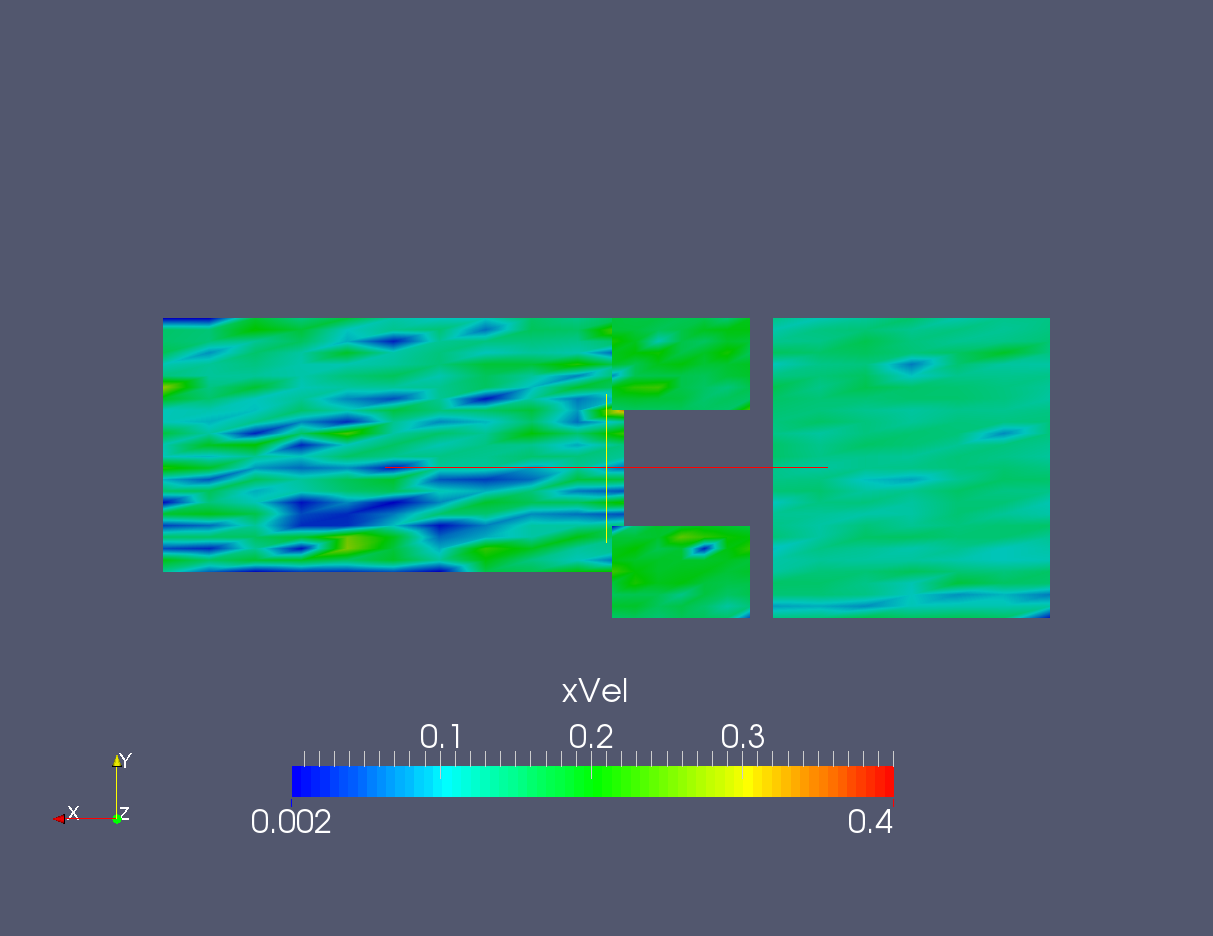
Attached is a screenshot of the animation I created in paraview. My data is 1178 points, each point has 400 vtk files (each vtk file is a new time step) so the animation is playing the 400 vtks in a sequence. This dataset has x,y,z coordinates so how should I input the data so that streamlines can be defined?
---
### Author:  [@Raychel\_Bahnick](https://discourse.paraview.org/u/Raychel_Bahnick)
#### Post date: [July 23, 2019, 2:20pm UTC](https://discourse.paraview.org/t/associating-time-to-data-in-order-to-animate/2231/8 "2019-07-23T14:20:42Z")
I just wanted to check in and see if you have any advice after I attached my data in the previous message? I am still trying to use streamlines in my animated data.
Thanks!
---
### Author:  [@cory.quammen](https://discourse.paraview.org/u/cory.quammen)
#### Post date: [July 23, 2019, 9:41pm UTC](https://discourse.paraview.org/t/associating-time-to-data-in-order-to-animate/2231/9 "2019-07-23T21:41:23Z")
What kind of data set is the data in now? If you click on the Information tab in ParaView, it will tell you as the value of the “Type:” field.
---
### Author:  [@Raychel\_Bahnick](https://discourse.paraview.org/u/Raychel_Bahnick)
#### Post date: [July 24, 2019, 1:27pm UTC](https://discourse.paraview.org/t/associating-time-to-data-in-order-to-animate/2231/10 "2019-07-24T13:27:15Z")
The Data Type is Rectilinear Grid
---
### Author:  [@cory.quammen](https://discourse.paraview.org/u/cory.quammen)
#### Post date: [July 24, 2019, 2:05pm UTC](https://discourse.paraview.org/t/associating-time-to-data-in-order-to-animate/2231/11 "2019-07-24T14:05:26Z")
You should now be able to add a **Stream Tracer** and position the seed point source relative to your data, and run it. See Exercise 2.12 in the [ParaView tutorial](https://www.paraview.org/Wiki/images/b/bc/ParaViewTutorial56.pdf) for an example.
If your data is two dimensional, you can check the “Surface Streamlines” checkbox, and that will restrict the integration to only the in-plane components of the vector field.
---
### Author:  [@Raychel\_Bahnick](https://discourse.paraview.org/u/Raychel_Bahnick)
#### Post date: [July 24, 2019, 6:44pm UTC](https://discourse.paraview.org/t/associating-time-to-data-in-order-to-animate/2231/12 "2019-07-24T18:44:44Z")
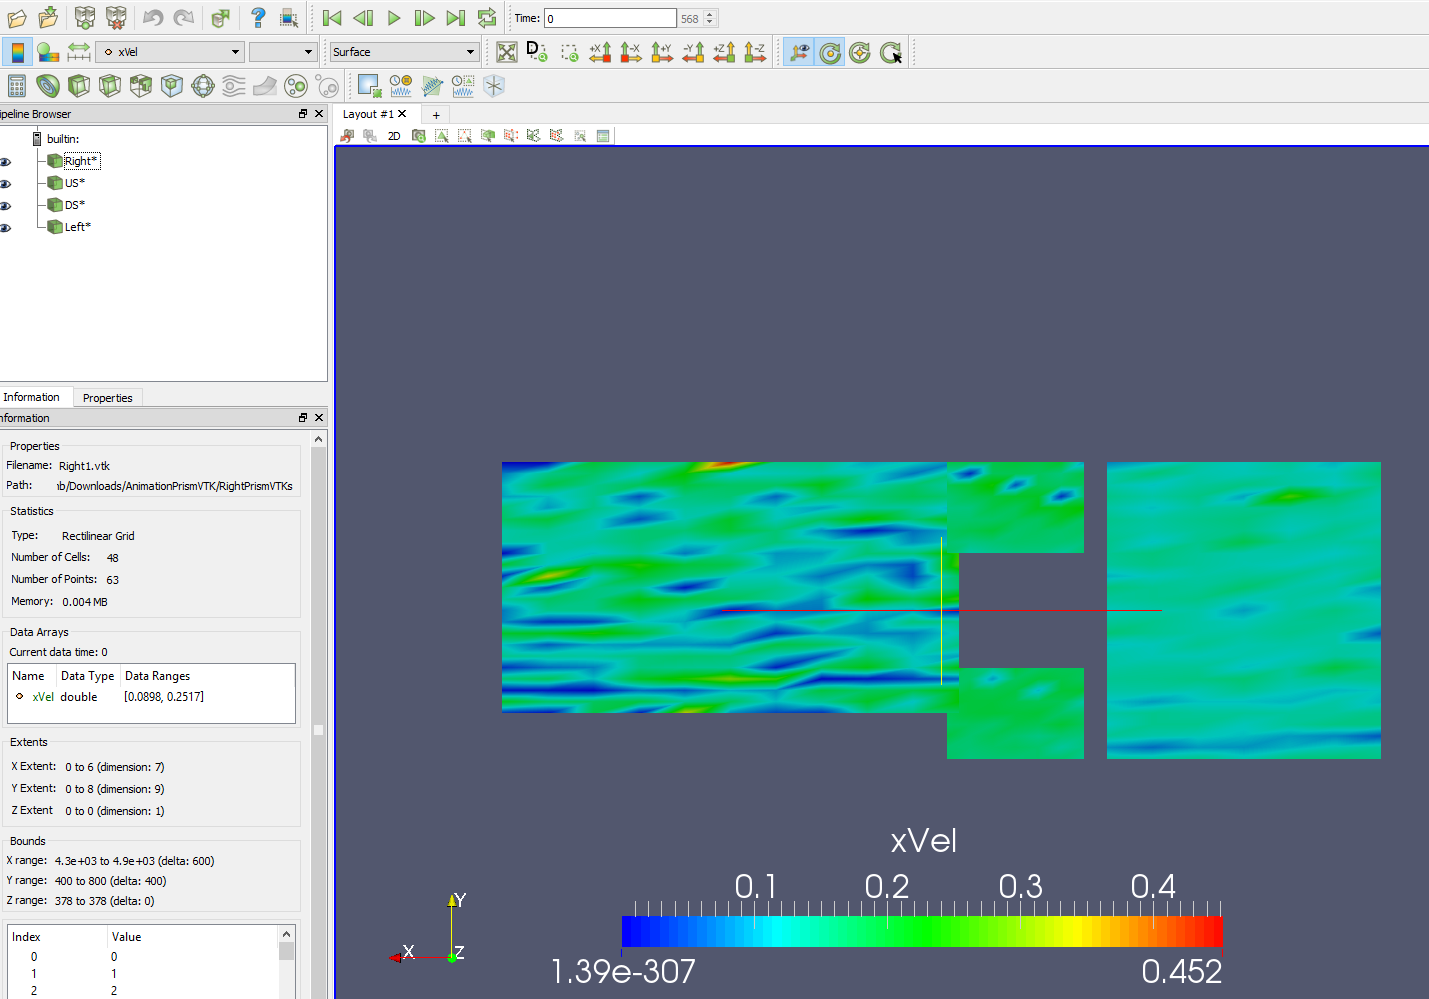
Attached is the image from my paraview data. I can not follow exercise 2.12 because the Stream Tracer is greyed out as you can see and I do not know why.
---
### Author:  [@cory.quammen](https://discourse.paraview.org/u/cory.quammen)
#### Post date: [July 24, 2019, 6:58pm UTC](https://discourse.paraview.org/t/associating-time-to-data-in-order-to-animate/2231/13 "2019-07-24T18:58:04Z")
Would you mind attaching your dataset? I don’t think it was attached in your earlier post.
---
### Author:  [@Raychel\_Bahnick](https://discourse.paraview.org/u/Raychel_Bahnick)
#### Post date: [July 24, 2019, 7:24pm UTC](https://discourse.paraview.org/t/associating-time-to-data-in-order-to-animate/2231/14 "2019-07-24T19:24:10Z")
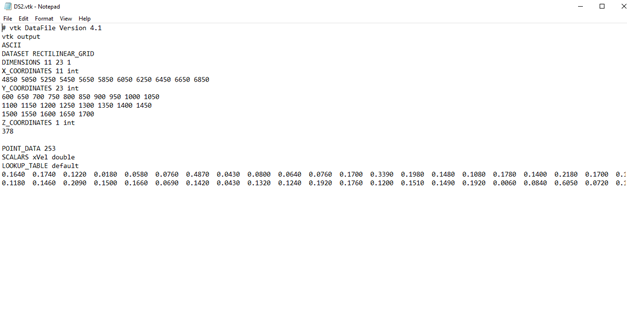
Yes! Here is what one .vtk file looks like. Each of the 1178 points has 400 vtk files (each vtk file is a new time step) so the animation is playing the 400 vtks in a sequence
---
### Author:  [@cory.quammen](https://discourse.paraview.org/u/cory.quammen)
#### Post date: [July 24, 2019, 9:41pm UTC](https://discourse.paraview.org/t/associating-time-to-data-in-order-to-animate/2231/15 "2019-07-24T21:41:55Z")
Can you share one VTK file for one timestep? Either attach it here (you might want to compress it) or send it to me directly if it is confidential ([cory.quammen@kitware.com](mailto:cory.quammen@kitware.com))?
---
### Author:  [@Raychel\_Bahnick](https://discourse.paraview.org/u/Raychel_Bahnick)
#### Post date: [July 24, 2019, 10:14pm UTC](https://discourse.paraview.org/t/associating-time-to-data-in-order-to-animate/2231/16 "2019-07-24T22:14:00Z")
Here is a zipped file of one of my Tests that is named ‘Right’. There are 63 points in this test and a total of 399 vtk files.
[VTK Files.zip](https://discourse.paraview.org/uploads/short-url/15ILqdOHAaTHn9mBPh1ECgbmeEp.zip) (194.2 KB)
---
### Author:  [@cory.quammen](https://discourse.paraview.org/u/cory.quammen)
#### Post date: [July 25, 2019, 2:13pm UTC](https://discourse.paraview.org/t/associating-time-to-data-in-order-to-animate/2231/17 "2019-07-25T14:13:59Z")
There are two issues I see in the data sets.
1. There is a single scalar array named `xVel`. You mentioned having vector values at each of these points. I would expect to have a `xVel`, `yVel`, and maybe `zVel` array for the three components in a vector field. Since you have a 2D domain, you may have just two components, but that’s fine. You can combine separave `xVel`, `yVel`, and `zVel` arrays into a single vector array (where each array value has 3 components corresponding to X, Y, and Z velocity components) and then use that velocity array in the **Stream Tracer**. With just a single `xVel` array, the **Stream Tracer** will not work.
2. There are 69 values defined in the `xVel` array, but only 63 points. The number of array values and points should match.
---
### Author:  [@Raychel\_Bahnick](https://discourse.paraview.org/u/Raychel_Bahnick)
#### Post date: [July 25, 2019, 4:19pm UTC](https://discourse.paraview.org/t/associating-time-to-data-in-order-to-animate/2231/18 "2019-07-25T16:19:57Z")
Thank you for this insight. I have made the change so that array value and points are both 63.
It make sense to need two components for the velocity vector. I will input yVel array into my VTK files. How is that fomatted? Will the POINT\_DATA be 126 since there will be 63 xVel and 63 yVel? Do I include a second LOOKUP\_TABLE that will have all the yVel listed?
---
### Author:  [@cory.quammen](https://discourse.paraview.org/u/cory.quammen)
#### Post date: [July 25, 2019, 5:38pm UTC](https://discourse.paraview.org/t/associating-time-to-data-in-order-to-animate/2231/19 "2019-07-25T17:38:26Z")
It should look like this:
```nohighlight
SCALARS xVel float 1
LOOKUP_TABLE default
<63 data values for xVel>
SCALARS yVel float 1
LOOKUP_TABLE default
<63 data values for yVel>
```
With this approach, you will need to use the **Calculator** filter to assemble the different components into a vector value. This expression for the calculator should be
`xVel * iHat + yVel * jHat`
A different, probably better way: you can put the velocities together into one VECTORS array:
```nohighlight
VECTORS vel float
xVel_0 yVel_0 0
xVel_1 yVel_1 0
<61 more entries like this>
```
Note the the vectors are assumed to have 3 components (they exist in 3D space), so the last column contains 0s for the z-component. The only real downside to doing it this way is the extra 2\*63 bytes to hold the space and `0` characters, but you won’t need to use the **Calculator** filter to assemble the vector components into a vector array, so it should be simpler.
Attached is an example file with both approaches. [Right1.vtk](https://discourse.paraview.org/uploads/short-url/tVwS4xwh7aw8XL2HXjy2rScInTo.vtk) (2.2 KB)
---
### Author:  [@Raychel\_Bahnick](https://discourse.paraview.org/u/Raychel_Bahnick)
#### Post date: [July 25, 2019, 7:03pm UTC](https://discourse.paraview.org/t/associating-time-to-data-in-order-to-animate/2231/20 "2019-07-25T19:03:06Z")
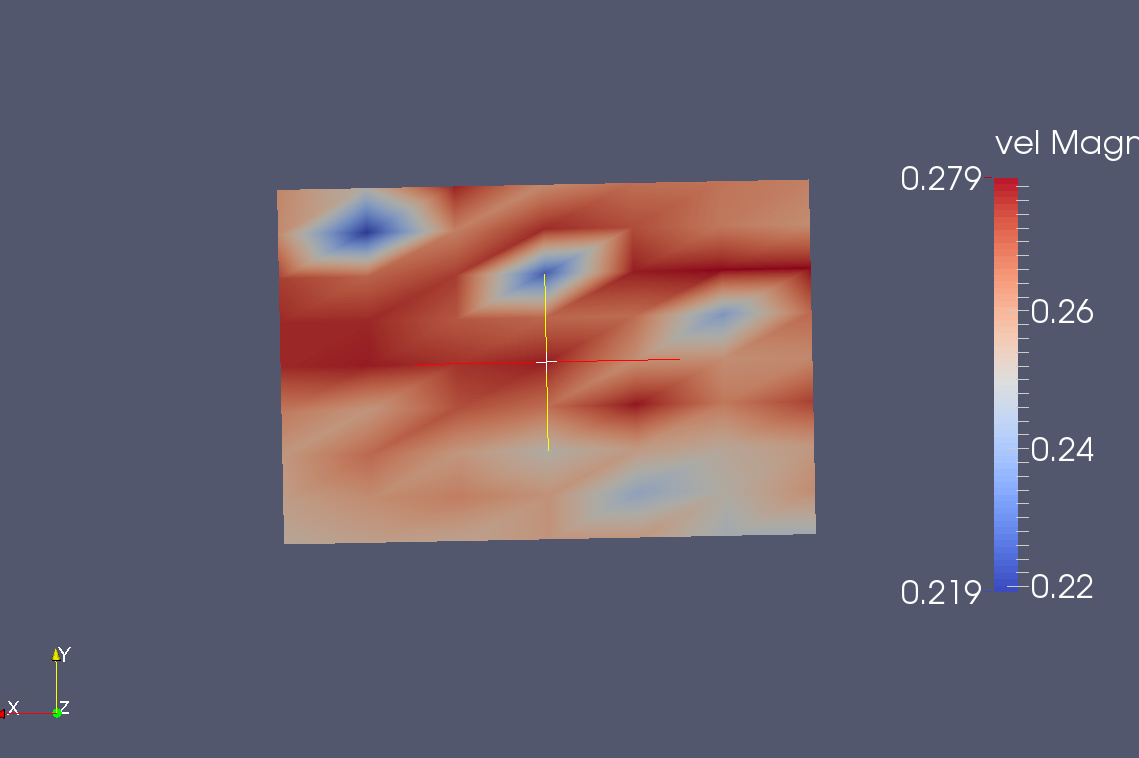
I have decided to follow your advice and go with the better way. When I apply the stream tracer filter, no vectors/streamlines show. Attached is a picture with the stream tracer on.
[Next page](https://discourse.paraview.org/t/associating-time-to-data-in-order-to-animate/2231.md?page=2)