# Boundingruler/Xticks/Minorgridlines for Lineplot
**URL:** https://discourse.paraview.org/t/boundingruler-xticks-minorgridlines-for-lineplot/4299
**Category:** ParaView Support
**Created:** [May 11, 2020, 10:05am UTC](https://discourse.paraview.org/t/boundingruler-xticks-minorgridlines-for-lineplot/4299 "2020-05-11T10:05:38Z")
**Posts on this page:** 6
**Page:** 1
### Author:  [@vrkssai](https://discourse.paraview.org/u/vrkssai)
#### Post date: [May 11, 2020, 10:05am UTC](https://discourse.paraview.org/t/boundingruler-xticks-minorgridlines-for-lineplot/4299/1 "2020-05-11T10:05:38Z")
Hi all
I’m looking for xticks/minorgridlines/bounding ruler type options for plotting 1D Lineplots. For example: for a 1D Finite Volume problem say, I want to represent the ends of each cell (My need is slightly more complicated though) . I’m looking for ways to for example, create custom minor gridlines in ydirection(perp to xaxis), so I can pick the divisions=no. of cells, to represent the cell ends.
Simply speaking, in the below screenshot of Lineplot, if you can notice the boxes made the gridlines in x and y directions, I basically want to choose number of those boxes in x directions.
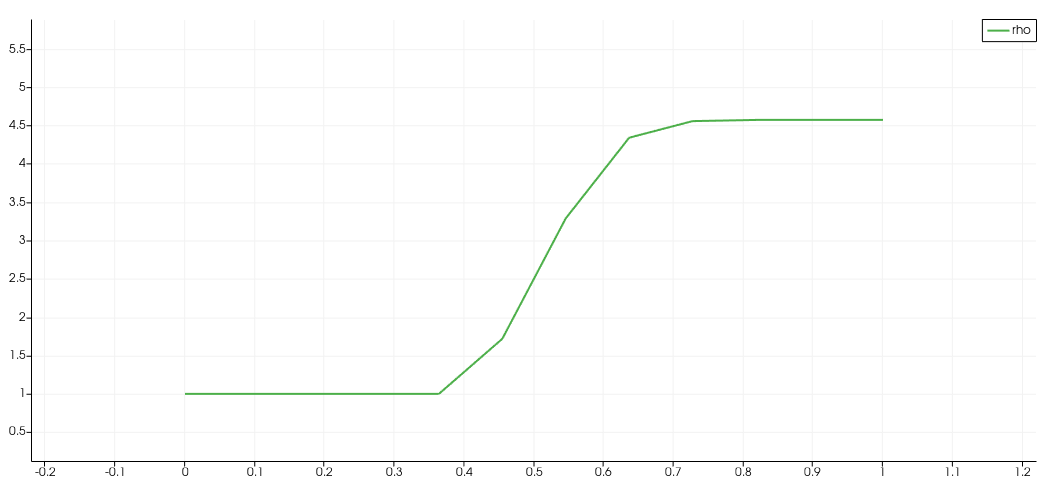 .
I know I can add custom labels to Bottom axis, but I need a way to do this for a large number of uniformly distributed divisions, I’m looking for a quick easy way instead of manually adding each custom label
---
### Author:  [@mwestphal](https://discourse.paraview.org/u/mwestphal)
#### Post date: [May 12, 2020, 1:57am UTC](https://discourse.paraview.org/t/boundingruler-xticks-minorgridlines-for-lineplot/4299/2 "2020-05-12T01:57:24Z")
If you can compute the correct values, then you can do it with a calculator then use the new array as the x Axis.
---
### Author:  [@vrkssai](https://discourse.paraview.org/u/vrkssai)
#### Post date: [May 13, 2020, 1:11am UTC](https://discourse.paraview.org/t/boundingruler-xticks-minorgridlines-for-lineplot/4299/4 "2020-05-13T01:11:10Z")
Could you elaborate please?, I don’t understand. For instance say in the xrange of 0-1 I need 11 custom labels, 0.0,0.1 0.2,0.3,0.4…,1.0, how would we do this, with the method you suggested?
---
### Author:  [@mwestphal](https://discourse.paraview.org/u/mwestphal)
#### Post date: [May 13, 2020, 1:17am UTC](https://discourse.paraview.org/t/boundingruler-xticks-minorgridlines-for-lineplot/4299/5 "2020-05-13T01:17:52Z")
Do you have an array on your data containing these values ?
---
### Author:  [@vrkssai](https://discourse.paraview.org/u/vrkssai)
#### Post date: [May 13, 2020, 1:21am UTC](https://discourse.paraview.org/t/boundingruler-xticks-minorgridlines-for-lineplot/4299/7 "2020-05-13T01:21:51Z")
I don’t actually, any easy way to create in paraview directly?(Given I know some details like as specified in the above example-(0.0,0.1,0.2,…,1.0),etc). We cant get such data from plot over line right? I use legrange hexadron type cells.
---
### Author:  [@mwestphal](https://discourse.paraview.org/u/mwestphal)
#### Post date: [May 13, 2020, 2:06am UTC](https://discourse.paraview.org/t/boundingruler-xticks-minorgridlines-for-lineplot/4299/8 "2020-05-13T02:06:42Z")
PlotOverLine generate a “arc\_length” array. You can use the calculator to divide it by its max value and use results as the X axis.