# Can I view solutions on a 1D mesh (from a .vtu file)
**URL:** https://discourse.paraview.org/t/can-i-view-solutions-on-a-1d-mesh-from-a-vtu-file/3823
**Category:** ParaView Support
**Tags:** vtk
**Created:** [March 15, 2020, 8:03pm UTC](https://discourse.paraview.org/t/can-i-view-solutions-on-a-1d-mesh-from-a-vtu-file/3823 "2020-03-15T20:03:58Z")
**Posts on this page:** 18
**Page:** 1
### Author:  [@krishnakumar](https://discourse.paraview.org/u/krishnakumar)
#### Post date: [March 15, 2020, 8:03pm UTC](https://discourse.paraview.org/t/can-i-view-solutions-on-a-1d-mesh-from-a-vtu-file/3823/1 "2020-03-15T20:03:58Z")
Using deal.II, I have written the finite-element simulation results of a 1D time-dependent diffusion equation as a set of .vtu files (one per time-step). Is there a way I can use paraview to visualise the results?
---
### Author:  [@mwestphal](https://discourse.paraview.org/u/mwestphal)
#### Post date: [March 16, 2020, 2:11am UTC](https://discourse.paraview.org/t/can-i-view-solutions-on-a-1d-mesh-from-a-vtu-file/3823/2 "2020-03-16T02:11:28Z")
make sure your set of data file are numbered like this:
```
data_1.vtu
data_2.vtu
...
data_n.vtu
```
You should then be able to open the file series in ParaView.
---
### Author:  [@krishnakumar](https://discourse.paraview.org/u/krishnakumar)
#### Post date: [March 16, 2020, 4:22pm UTC](https://discourse.paraview.org/t/can-i-view-solutions-on-a-1d-mesh-from-a-vtu-file/3823/3 "2020-03-16T16:22:10Z")
Hi,
Thank you for your reply.
However, my question was specifically about the 1D visualisation capabilities of Paraview. It doesn’t look like ParaView can handle 1D meshes at all. Is that correct?
Krishna
---
### Author:  [@MiguelAngelAGUIRRE](https://discourse.paraview.org/u/MiguelAngelAGUIRRE)
#### Post date: [March 16, 2020, 5:56pm UTC](https://discourse.paraview.org/t/can-i-view-solutions-on-a-1d-mesh-from-a-vtu-file/3823/4 "2020-03-16T17:56:13Z")
Hello,
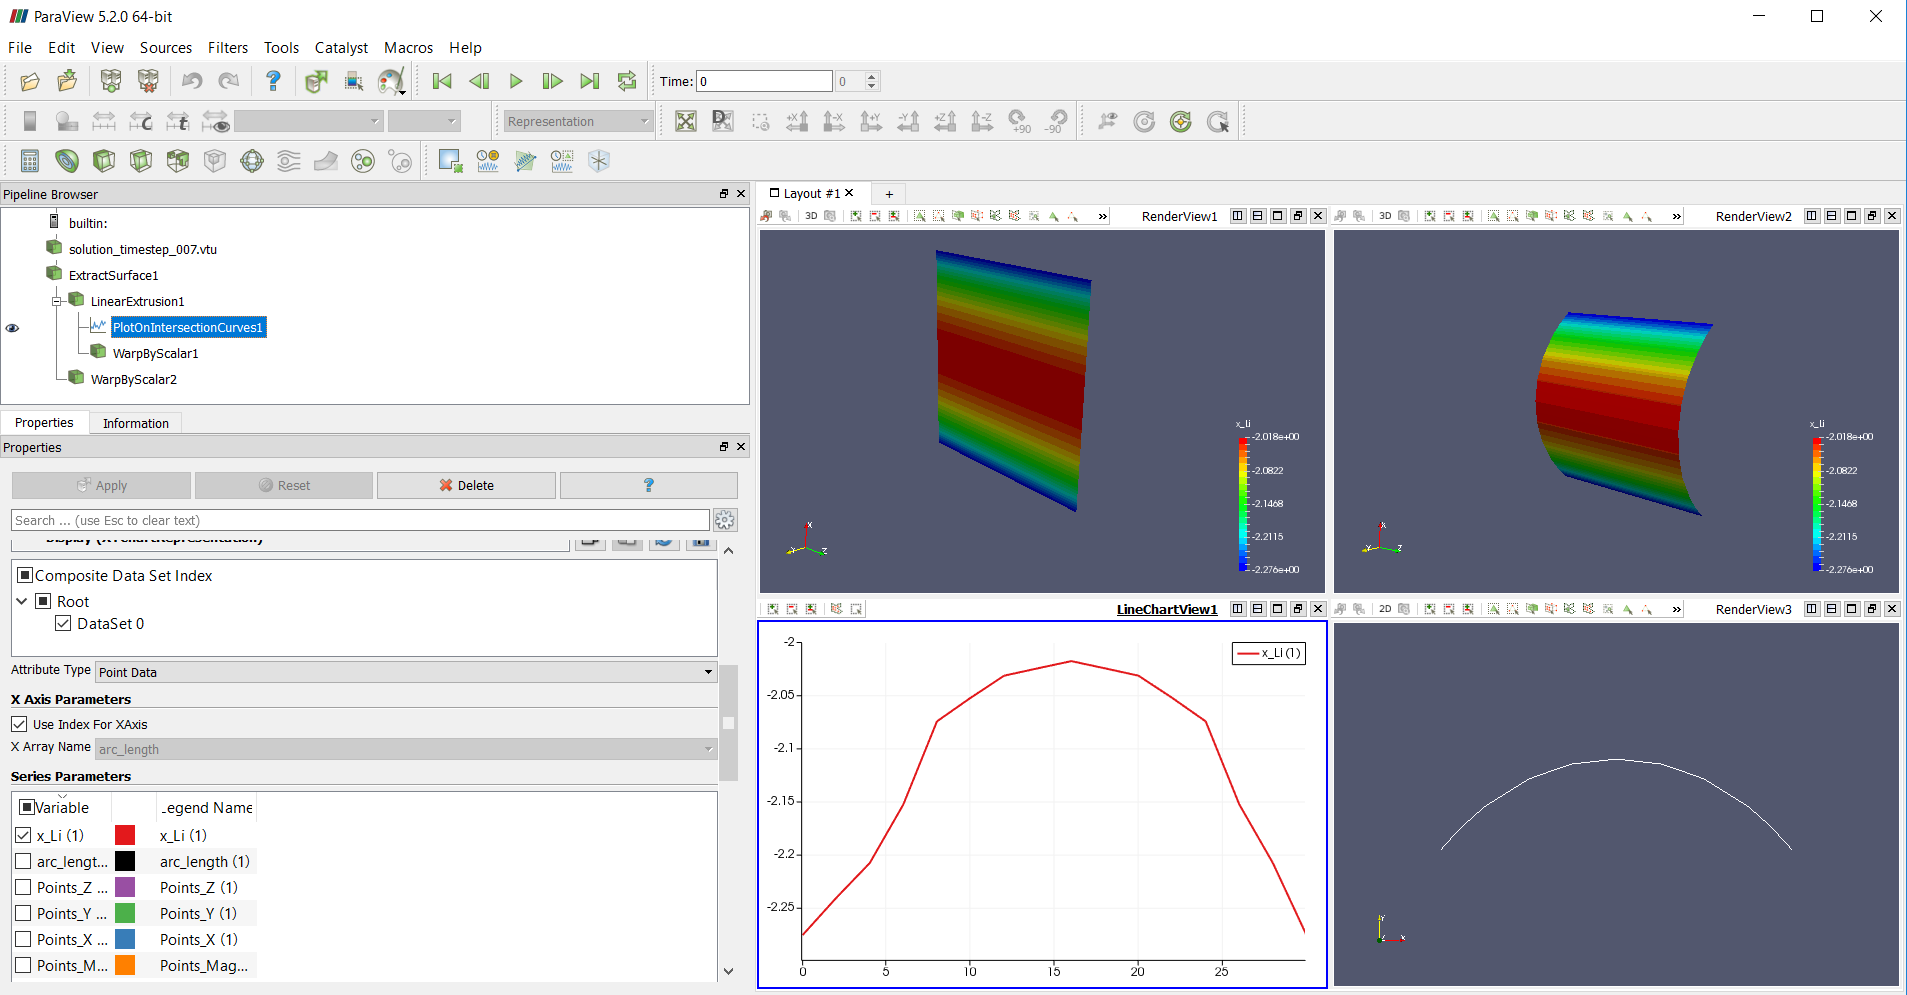
A mesh line (1D) can be visualized in several ways. Maybe you can try the LinearExtrusion filter if you want to see a surface from the line mesh. Another alternative is to use WarpByScalar: this deforms the line mesh into a curve depending on the value of a given scalar (you can also apply that filter to the LinearExtrusion output in order to warp the extruded surface). Moreover, you can use the PlotData filter in order to obtain a classical XY plot. These are the tools that I use the most for those applications.
Best regards,
Miguel
---
### Author:  [@krishnakumar](https://discourse.paraview.org/u/krishnakumar)
#### Post date: [March 16, 2020, 6:07pm UTC](https://discourse.paraview.org/t/can-i-view-solutions-on-a-1d-mesh-from-a-vtu-file/3823/5 "2020-03-16T18:07:54Z")
Thank you very much for your reply. The LinearExtrusion filter is greyed out, and the warp by scalar doesn’t produce what I want.
All that I want is a spatial plot of mesh co-ordinates (x) vs solution value (y). Attached is the data file that I have to visualise. Can you please help further?[solution\_timestep\_007.vtu](https://discourse.paraview.org/uploads/short-url/p6EwjOxT7Uok35mPEa9kHQPVtpy.vtu) (1.3 KB)
---
### Author:  [@MiguelAngelAGUIRRE](https://discourse.paraview.org/u/MiguelAngelAGUIRRE)
#### Post date: [March 16, 2020, 6:38pm UTC](https://discourse.paraview.org/t/can-i-view-solutions-on-a-1d-mesh-from-a-vtu-file/3823/6 "2020-03-16T18:38:45Z")
Hi,
Here you have a PVSM file with all the things you can do with your data (Just in case: File–\>LoadState–\>Open “TEST.pvsm”)
The key operation here is to apply the “ExtractSurface” filter: this allows recognizing the data as a 1D mesh and then you have acces to all the filters.
Regards,
Miguel
[TEST.pvsm](https://discourse.paraview.org/uploads/short-url/3pQpqBjoi009Bp3RxSZUdouutqg.pvsm) (442.8 KB)
---
### Author:  [@krishnakumar](https://discourse.paraview.org/u/krishnakumar)
#### Post date: [March 16, 2020, 7:43pm UTC](https://discourse.paraview.org/t/can-i-view-solutions-on-a-1d-mesh-from-a-vtu-file/3823/7 "2020-03-16T19:43:02Z")
I just get a bunch of errors when opening the state file you attached. What version of Paraview did you use? Mine is 5.8.0
Can you please try opening my .vtu file, and see if you are able to do the 1D visualization on it?
Krishna
---
### Author:  [@mwestphal](https://discourse.paraview.org/u/mwestphal)
#### Post date: [March 17, 2020, 2:09am UTC](https://discourse.paraview.org/t/can-i-view-solutions-on-a-1d-mesh-from-a-vtu-file/3823/8 "2020-03-17T02:09:18Z")
@krishnakumar : a 1D dataset is just a line for paraview. Most of ParaView tools are for 3D dataset.
In any case, it may still be possible to achieve what you are trying to do.
So, what are you trying to do here ?
---
### Author:  [@krishnakumar](https://discourse.paraview.org/u/krishnakumar)
#### Post date: [March 17, 2020, 2:39am UTC](https://discourse.paraview.org/t/can-i-view-solutions-on-a-1d-mesh-from-a-vtu-file/3823/9 "2020-03-17T02:39:18Z")
@mwestphal I am literally trying to simply plot the solution values over the 1D spatial mesh (i.e. x-co-rdinate of mesh on the x-axis vs. the solution value in y-axis as a simple 2D line graph), and animate the solutions over various time-steps.
Attached are my solutions in .vtu file format. How can I do this very simple/basic thing?
[solution\_timestep\_000.vtu](https://discourse.paraview.org/uploads/short-url/sLerFE9GjfxA1rEQNl2o6c3BgUW.vtu) (1.12 KB)
[solution\_timestep\_008.vtu](https://discourse.paraview.org/uploads/short-url/xxeqPIdkTTdjiPKuoIRxT1L1j4U.vtu) (1.29 KB)
[solution\_timestep\_010.vtu](https://discourse.paraview.org/uploads/short-url/wCMDI2b6UGpsfVaOUKW2ZA5ufvW.vtu) (1.29 KB)
[solution\_timestep\_009.vtu](https://discourse.paraview.org/uploads/short-url/a3zc3ikuuhgfnwTqTYco9rIwxLh.vtu) (1.29 KB)
[solution\_timestep\_011.vtu](https://discourse.paraview.org/uploads/short-url/7IYMZj5hypQ8tXN8odGFdMxEjEk.vtu) (1.36 KB)
[solution\_timestep\_006.vtu](https://discourse.paraview.org/uploads/short-url/9cyGd2sX6zArWymZe6FYJ2oPq2S.vtu) (1.29 KB)
[solution\_timestep\_007.vtu](https://discourse.paraview.org/uploads/short-url/p6EwjOxT7Uok35mPEa9kHQPVtpy.vtu) (1.29 KB)
[solution\_timestep\_005.vtu](https://discourse.paraview.org/uploads/short-url/olrORnjoV3zplTtwAkploIT8QPg.vtu) (1.22 KB)
[solution\_timestep\_004.vtu](https://discourse.paraview.org/uploads/short-url/rKc8sODi94SYdkvNDeHZ9vKN134.vtu) (1.22 KB)
[solution\_timestep\_003.vtu](https://discourse.paraview.org/uploads/short-url/fEcRoRqDt1dPGTKp9voHpeA00oe.vtu) (1.22 KB)
[solution\_timestep\_002.vtu](https://discourse.paraview.org/uploads/short-url/nY5uwwSptzMCTh4m5kM4Nam7NtW.vtu) (1.22 KB)
[solution\_timestep\_001.vtu](https://discourse.paraview.org/uploads/short-url/cFE4fEViHeHEnHc8hkwbPB84Px.vtu) (1.17 KB)
---
### Author:  [@mwestphal](https://discourse.paraview.org/u/mwestphal)
#### Post date: [March 17, 2020, 2:42am UTC](https://discourse.paraview.org/t/can-i-view-solutions-on-a-1d-mesh-from-a-vtu-file/3823/10 "2020-03-17T02:42:54Z")
`Filters -> PlotData`
---
### Author:  [@krishnakumar](https://discourse.paraview.org/u/krishnakumar)
#### Post date: [March 17, 2020, 2:45am UTC](https://discourse.paraview.org/t/can-i-view-solutions-on-a-1d-mesh-from-a-vtu-file/3823/11 "2020-03-17T02:45:02Z")
@mwestphal `PlotData` is greyed out for me…Can you please try on your end?
---
### Author:  [@mwestphal](https://discourse.paraview.org/u/mwestphal)
#### Post date: [March 17, 2020, 2:47am UTC](https://discourse.paraview.org/t/can-i-view-solutions-on-a-1d-mesh-from-a-vtu-file/3823/12 "2020-03-17T02:47:39Z")
I did. Press Apply.
---
### Author:  [@krishnakumar](https://discourse.paraview.org/u/krishnakumar)
#### Post date: [March 17, 2020, 2:49am UTC](https://discourse.paraview.org/t/can-i-view-solutions-on-a-1d-mesh-from-a-vtu-file/3823/13 "2020-03-17T02:49:28Z")
@mwestphal Aah. Got it. Thank you very much. Is there a way to show the x-axis values as that of the original mesh (rather than the data point number?). My mesh is a unit mesh in (0,1).
---
### Author:  [@mwestphal](https://discourse.paraview.org/u/mwestphal)
#### Post date: [March 17, 2020, 5:42am UTC](https://discourse.paraview.org/t/can-i-view-solutions-on-a-1d-mesh-from-a-vtu-file/3823/14 "2020-03-17T05:42:04Z")
Uncheck “Use index for X Axis”, and select the array you want to use.
---
### Author:  [@MiguelAngelAGUIRRE](https://discourse.paraview.org/u/MiguelAngelAGUIRRE)
#### Post date: [March 17, 2020, 8:41am UTC](https://discourse.paraview.org/t/can-i-view-solutions-on-a-1d-mesh-from-a-vtu-file/3823/15 "2020-03-17T08:41:56Z")
Hi,
Here you have an image of my pipeline browser and the kind of analyses you can obtain from your data. In the left panel you have the setup I used for the PlotOnIntersection line
I hope this helps.
Best regards,
Miguel
---
### Author:  [@krishnakumar](https://discourse.paraview.org/u/krishnakumar)
#### Post date: [March 17, 2020, 3:09pm UTC](https://discourse.paraview.org/t/can-i-view-solutions-on-a-1d-mesh-from-a-vtu-file/3823/16 "2020-03-17T15:09:46Z")
Thank you so much! That helps a lot.
Is there any way to keep the y-axes limits of the plots constant over time. i.e. in the animation, if the y-axis limits keep changing between time-steps, it is rather distracting. It is better for the curve to become smaller and have the y-axis fixed.
Once again, thank you so much for your inputs so far. They have been tremendously helpful.
Regards,
Krishna
---
### Author:  [@mwestphal](https://discourse.paraview.org/u/mwestphal)
#### Post date: [March 18, 2020, 1:07am UTC](https://discourse.paraview.org/t/can-i-view-solutions-on-a-1d-mesh-from-a-vtu-file/3823/17 "2020-03-18T01:07:48Z")
Check “Left Axis use custom range”
---
### Author:  [@Debasis\_Das](https://discourse.paraview.org/u/Debasis_Das)
#### Post date: [May 28, 2021, 10:12am UTC](https://discourse.paraview.org/t/can-i-view-solutions-on-a-1d-mesh-from-a-vtu-file/3823/18 "2021-05-28T10:12:13Z")
The step-by-step procedure to generate the 1D mesh data plot are
1. Load the vtu file in paraview.
2. Select visible (eye option icon) from the pipeline browser.
3. Press apply from Properties (just below pipeline browser).
4. Click Filters —\> Data Analysis —\> Plot Data
5. Select the visible (eye option) icon of the PlotData option from the pipeline browser.
6. Then click Apply from the Properties (just below pipeline browser) to see the plot.
This documentation with pictures can be found in the following link. [Plot\_1D\_mesh\_data\_in\_Paraview\_from\_vtu\_file.pdf - Google Drive](https://drive.google.com/file/d/1Y5FPHQC90YFZ0fLMNj9dghWguvZBZk7M/view?usp=sharing)