# Can paraview correctly volume render two datasets at once?
**URL:** https://discourse.paraview.org/t/can-paraview-correctly-volume-render-two-datasets-at-once/10123
**Category:** ParaView Support
**Created:** [August 9, 2022, 7:35am UTC](https://discourse.paraview.org/t/can-paraview-correctly-volume-render-two-datasets-at-once/10123 "2022-08-09T07:35:37Z")
**Posts on this page:** 12
**Page:** 1
### Author:  [@ericwhester](https://discourse.paraview.org/u/ericwhester)
#### Post date: [August 9, 2022, 7:35am UTC](https://discourse.paraview.org/t/can-paraview-correctly-volume-render-two-datasets-at-once/10123/1 "2022-08-09T07:35:37Z")
Hello everyone,
I am simulating a multiphase fluid, and would like to volume render the concentration of two different fields simultaneously.
I have imported two different concentration fields into paraview and rendered both of them, however I find that the depth integration isn’t correct. One field always obscures the other, regardless of opacity and occlusion. Here are example plots from two different angles. You can see the blue phase is obscuring the red phase despite being behind it.


Is it possible to volume render multiple dataset simultaneously with correct occlusion? Or can paraview only correctly volume render with a single field?
This has been noted [before](https://gitlab.kitware.com/paraview/paraview/-/issues/19355), however I don’t think there were any fixes proposed.
Thanks for any help
---
### Author:  [@mwestphal](https://discourse.paraview.org/u/mwestphal)
#### Post date: [August 9, 2022, 7:44am UTC](https://discourse.paraview.org/t/can-paraview-correctly-volume-render-two-datasets-at-once/10123/2 "2022-08-09T07:44:24Z")
Hi @ericwhester ,
You may want to try grouping them into a multiblock.
What type is your data ?
Best,
---
### Author:  [@ericwhester](https://discourse.paraview.org/u/ericwhester)
#### Post date: [August 9, 2022, 7:47am UTC](https://discourse.paraview.org/t/can-paraview-correctly-volume-render-two-datasets-at-once/10123/3 "2022-08-09T07:47:35Z")
Hello Mathieu,
I’m afraid I don’t understand what it means to group them into a multiblock?
My dataset is two separate RectilinearGrid vtk files (.vtr) over several timesteps.
Thanks,
Eric
---
### Author:  [@mwestphal](https://discourse.paraview.org/u/mwestphal)
#### Post date: [August 9, 2022, 7:53am UTC](https://discourse.paraview.org/t/can-paraview-correctly-volume-render-two-datasets-at-once/10123/4 "2022-08-09T07:53:15Z")
Hi @ericwhester ,
I meant to use the GroupDataset filter, but there is no volume rendering available in that case.
But you can then use resampleToImage
---
### Author:  [@ericwhester](https://discourse.paraview.org/u/ericwhester)
#### Post date: [August 9, 2022, 7:56am UTC](https://discourse.paraview.org/t/can-paraview-correctly-volume-render-two-datasets-at-once/10123/5 "2022-08-09T07:56:05Z")
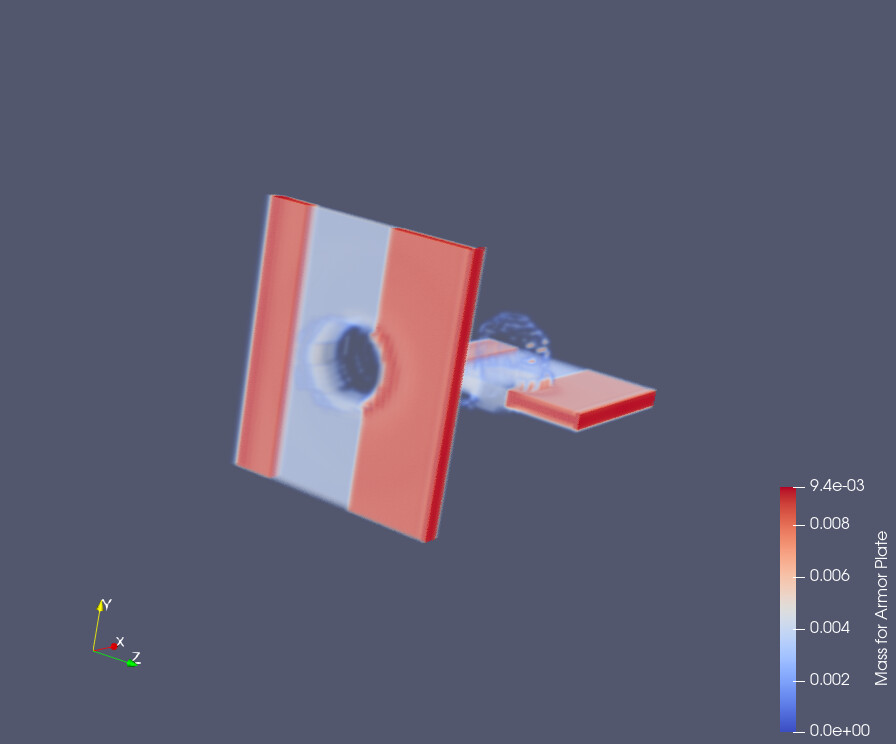
Does the attached image visualise two separate fields?
Could you elaborate on resampleToImage, or point me to a resource explaining what it is for and how to use it?
Thanks!
---
### Author:  [@mwestphal](https://discourse.paraview.org/u/mwestphal)
#### Post date: [August 9, 2022, 8:00am UTC](https://discourse.paraview.org/t/can-paraview-correctly-volume-render-two-datasets-at-once/10123/6 "2022-08-09T08:00:54Z")
> Does the attached image visualise two separate fields?
No, this is two VTR showing the same field
> Could you elaborate on resampleToImage, or point me to a resource explaining what it is for and how to use it?
- Open file1.vtr, apply
- Open file2.vtr, apply
- Select file1 et file2 (using Ctrl), Add a GroupDataSet filter, Apply
- Add a ResampleToImage filter, Apply
- Volume representation
---
### Author:  [@ericwhester](https://discourse.paraview.org/u/ericwhester)
#### Post date: [August 9, 2022, 8:14am UTC](https://discourse.paraview.org/t/can-paraview-correctly-volume-render-two-datasets-at-once/10123/7 "2022-08-09T08:14:53Z")
If I do the following sequence, nothing appears:
1. Import c1, c2, apply both
2. Select both, add GroupDataSet filter, apply
3. ResampleToImage filter, apply
4. Volume representation on the ResampleToImage filter
5. Adjust the colormap range from [0,1e-38] to [0,1] (each field varies in this range).
Then unfortunately I don’t see anything.
Is there a step I have missed here? Like applying a volume representation to the c1, c2 filters? Or the groups?
Thanks,
Eric
---
### Author:  [@mwestphal](https://discourse.paraview.org/u/mwestphal)
#### Post date: [August 9, 2022, 8:26am UTC](https://discourse.paraview.org/t/can-paraview-correctly-volume-render-two-datasets-at-once/10123/8 "2022-08-09T08:26:56Z")
Please share your data.
---
### Author:  [@Kenneth\_Moreland](https://discourse.paraview.org/u/Kenneth_Moreland)
#### Post date: [August 9, 2022, 12:35pm UTC](https://discourse.paraview.org/t/can-paraview-correctly-volume-render-two-datasets-at-once/10123/9 "2022-08-09T12:35:44Z")
If you want to volume render 2 overlapping volumes, try turning on the `Enable Ray Tracing` option under the `View` portion of the `Properties` panel. This will turn on the OSPRay raycaster. OSPRay seems to behave well when volume rendering overlapping volumes whereas the standard render does not.
---
### Author:  [@ericwhester](https://discourse.paraview.org/u/ericwhester)
#### Post date: [August 9, 2022, 12:41pm UTC](https://discourse.paraview.org/t/can-paraview-correctly-volume-render-two-datasets-at-once/10123/10 "2022-08-09T12:41:27Z")
Hmm, so I tried to enable ray tracing with OSPRay raycaster. Unfortunately everything disappears when I do that.
For context I’m using Paraview 5.10.1 on a Mac OSX12.3.1.
I will try to upload a smaller example dataset tomorrow.
Eric
---
### Author:  [@ericwhester](https://discourse.paraview.org/u/ericwhester)
#### Post date: [August 9, 2022, 12:43pm UTC](https://discourse.paraview.org/t/can-paraview-correctly-volume-render-two-datasets-at-once/10123/11 "2022-08-09T12:43:32Z")
In the meantime, I think I can get passable results by showing partially transparent isocontours for each dataset.
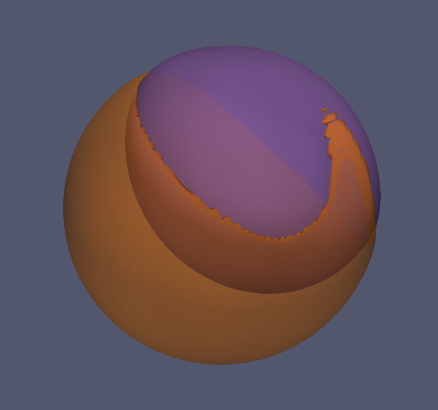
My new question: once I have a visualisation that I am happy with, how can I turn that into a batch python script to run remotely?
Thanks,
Eric
---
### Author:  [@mwestphal](https://discourse.paraview.org/u/mwestphal)
#### Post date: [August 10, 2022, 2:06am UTC](https://discourse.paraview.org/t/can-paraview-correctly-volume-render-two-datasets-at-once/10123/12 "2022-08-10T02:06:17Z")
File → SaveState → python should work.