# Can't plot custom range while using "Plot Over Line"
**URL:** https://discourse.paraview.org/t/cant-plot-custom-range-while-using-plot-over-line/16496
**Category:** ParaView Support
**Created:** [April 17, 2025, 9:37am UTC](https://discourse.paraview.org/t/cant-plot-custom-range-while-using-plot-over-line/16496 "2025-04-17T09:37:13Z")
**Posts on this page:** 3
**Page:** 1
### Author:  [@Smruti\_Ranjan\_Jena](https://discourse.paraview.org/u/Smruti_Ranjan_Jena)
#### Post date: [April 17, 2025, 9:37am UTC](https://discourse.paraview.org/t/cant-plot-custom-range-while-using-plot-over-line/16496/1 "2025-04-17T09:37:13Z")
Dear Paraview Support,
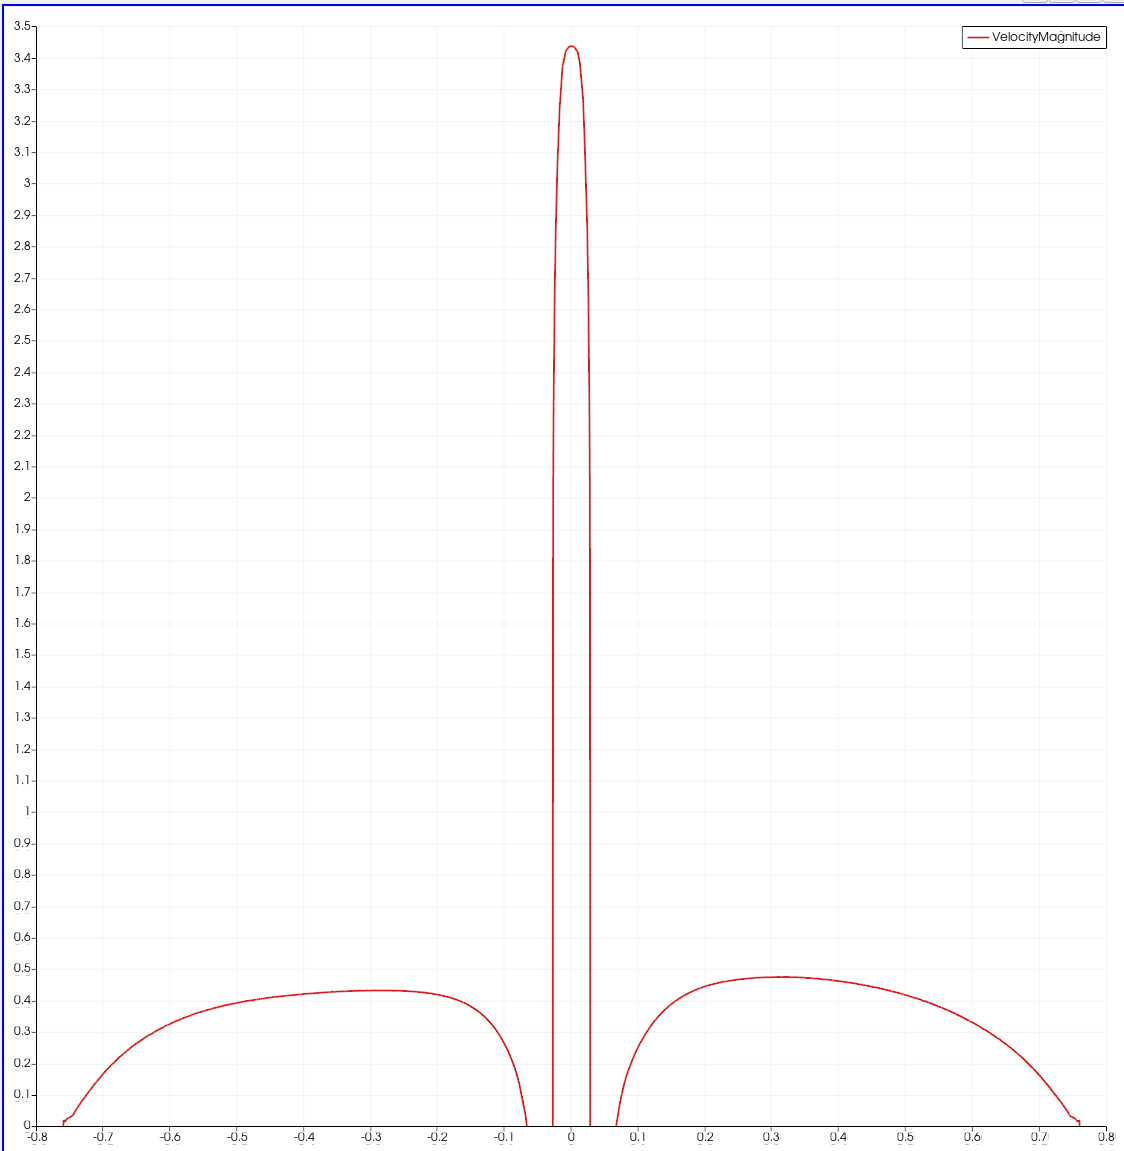
I am trying to plot a curve where the y-axis represents the velocity magnitude, whereas the x-axis represents the x-coordinates (image attached). In the properties panel, I can see that a custom range can be specified for the bottom axis, however, it only allows for mentioning a range (i.e. a maximum & a minimum value).
My question is “can I selectively remove the data from x = -0.05 to 0.05 and plot the rest i.e. 0.76 \< x \< 0.05 and -0.05 \< x \< -0.76”?
---
### Author:  [@nicolas.vuaille](https://discourse.paraview.org/u/nicolas.vuaille)
#### Post date: [April 17, 2025, 12:28pm UTC](https://discourse.paraview.org/t/cant-plot-custom-range-while-using-plot-over-line/16496/2 "2025-04-17T12:28:32Z")
Hi,
You will need to filter your data before the plot. For instance using a `Threshold` filter.
---
### Author:  [@Smruti\_Ranjan\_Jena](https://discourse.paraview.org/u/Smruti_Ranjan_Jena)
#### Post date: [April 18, 2025, 6:28am UTC](https://discourse.paraview.org/t/cant-plot-custom-range-while-using-plot-over-line/16496/3 "2025-04-18T06:28:23Z")
Thanks for your answer. That helped. However, the `Threshold` filter wasn’t showing the x-coordinate values in the scalars list, so I included a `calculator` to pass on that array, and it worked.
.