# Center Colourmap to Zero
**URL:** https://discourse.paraview.org/t/center-colourmap-to-zero/17587
**Category:** ParaView Support
**Created:** [May 28, 2026, 11:28am UTC](https://discourse.paraview.org/t/center-colourmap-to-zero/17587 "2026-05-28T11:28:45Z")
**Posts on this page:** 12
**Page:** 1
### Author:  [@Buggs\_Bunny](https://discourse.paraview.org/u/Buggs_Bunny)
#### Post date: [May 28, 2026, 11:28am UTC](https://discourse.paraview.org/t/center-colourmap-to-zero/17587/1 "2026-05-28T11:28:46Z")
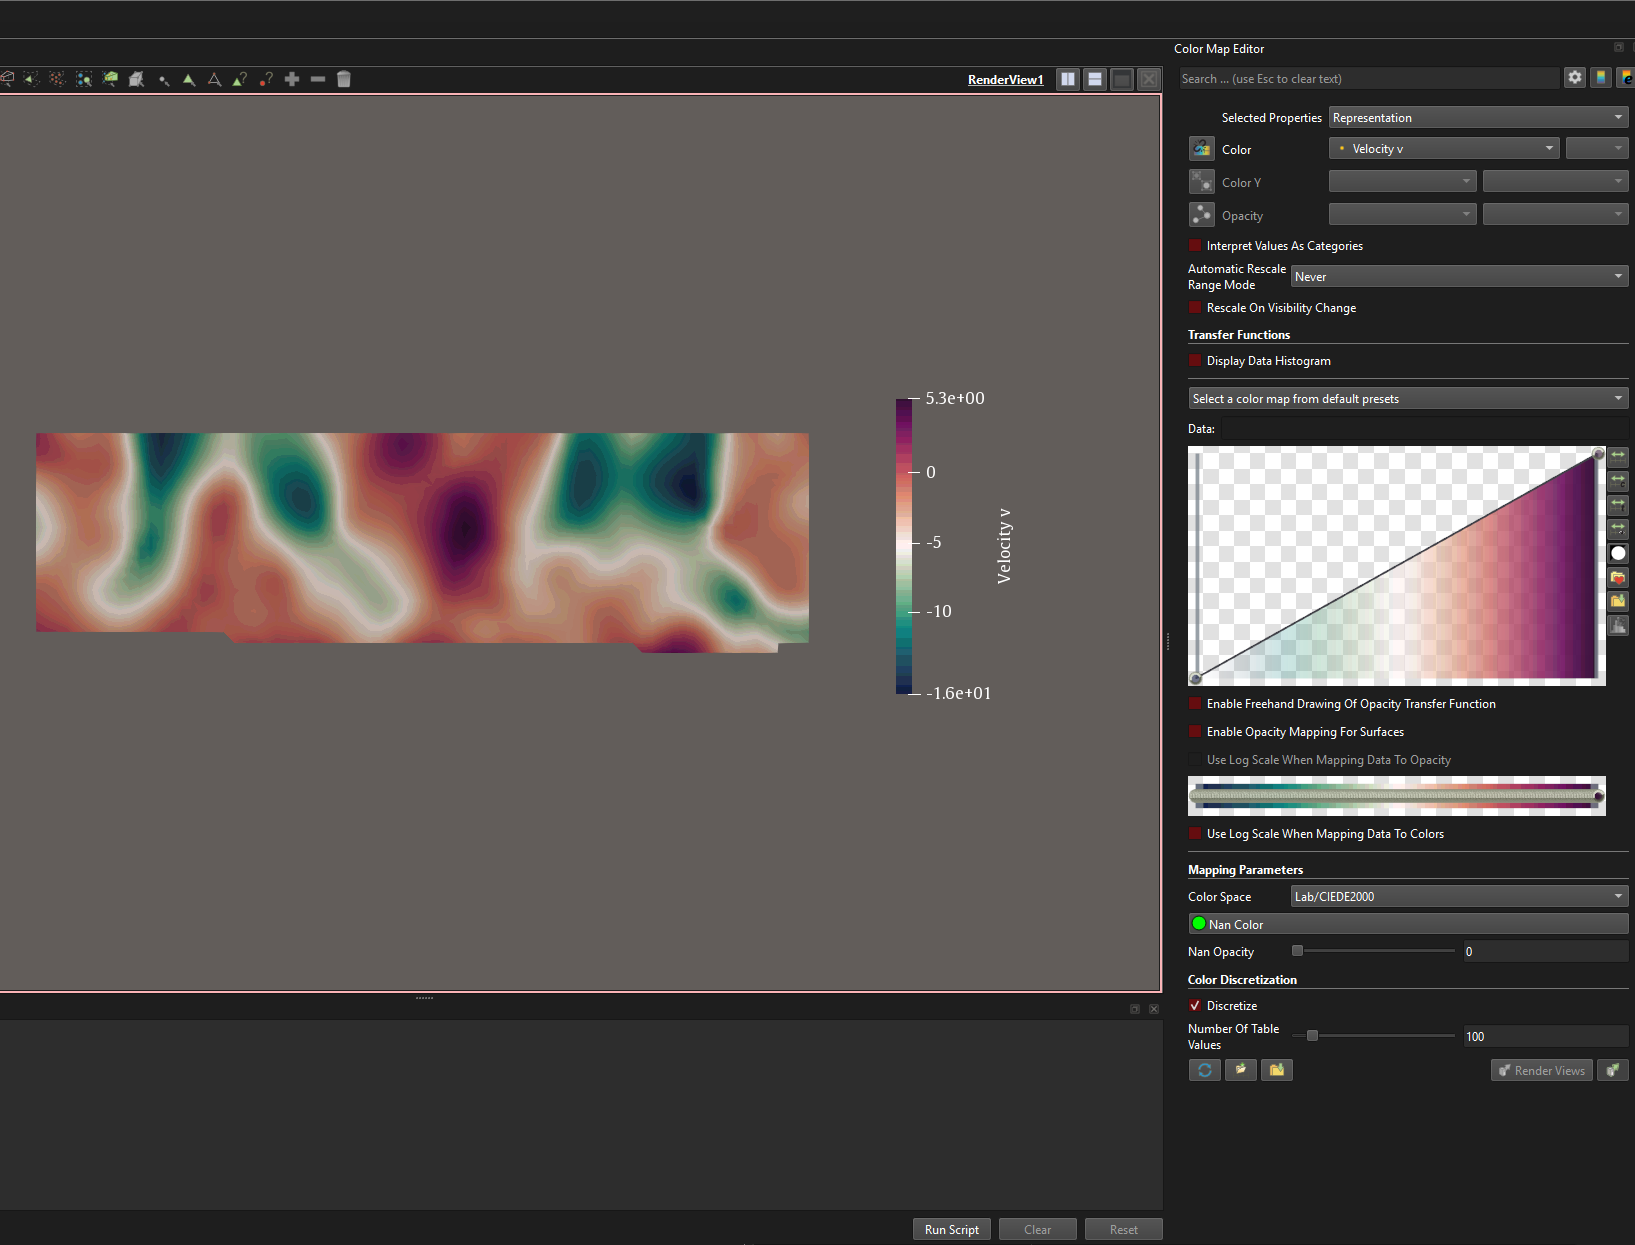
Hey, I have a dataset that is uneven about zero, I want to use a diverging color map. Is there a way I can set my zero velocity to be at the center of the color map? I have several datasets and timesteps so I would prefer a solution that is not too complicated.
I know I can custom set the range to something like -15 to 15 and I would get what I want, but that will make it harder to read maxia/minima.
---
### Author:  [@fvg](https://discourse.paraview.org/u/fvg)
#### Post date: [June 3, 2026, 2:36pm UTC](https://discourse.paraview.org/t/center-colourmap-to-zero/17587/2 "2026-06-03T14:36:52Z")
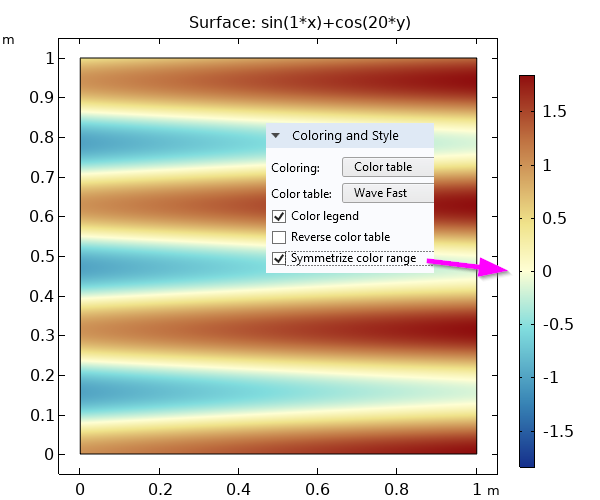
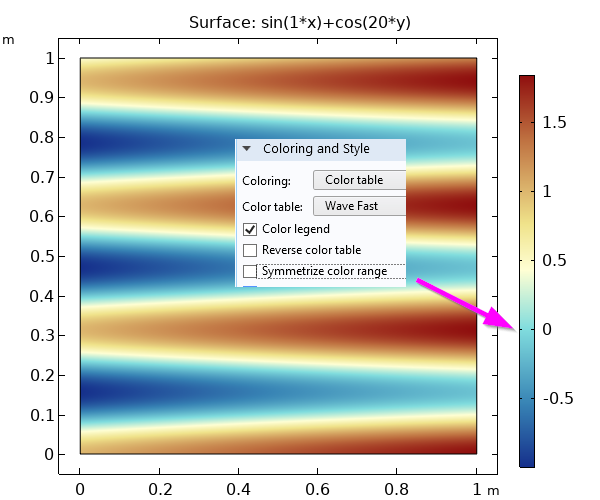
Indeed, a fast method to make these type of scales symmetric would be great.
See for instance the implementation below (comsol 5.5)
---
### Author:  [@Venke](https://discourse.paraview.org/u/Venke)
#### Post date: [June 4, 2026, 6:09am UTC](https://discourse.paraview.org/t/center-colourmap-to-zero/17587/3 "2026-06-04T06:09:02Z")
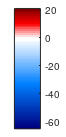
In order to read the min/max from the colorscale, it should not be symmetric. Min/max should be kept as they are, but the center color of the scale should be at zero. Like this:
---
### Author:  [@Buggs\_Bunny](https://discourse.paraview.org/u/Buggs_Bunny)
#### Post date: [June 4, 2026, 6:55am UTC](https://discourse.paraview.org/t/center-colourmap-to-zero/17587/4 "2026-06-04T06:55:05Z")
That’s right, Venke. This is exactly how I want it, unfortunately, seems like there is no other solution apart from making a new colour scheme and importing the .xml file.
---
### Author:  [@Venke](https://discourse.paraview.org/u/Venke)
#### Post date: [June 4, 2026, 7:24am UTC](https://discourse.paraview.org/t/center-colourmap-to-zero/17587/5 "2026-06-04T07:24:25Z")
I can’t see an easy way either. This is related to a feature request from 3 years ago “Improvements to colormaps / color ranges”, especially one of the answers [by David Thompson](https://discourse.paraview.org/t/improvements-to-colormaps-color-ranges/12754/2). Maybe a new feature request or jumping in on the old one could bring new attention to this topic.
---
### Author:  [@Lucas\_Givord](https://discourse.paraview.org/u/Lucas_Givord)
#### Post date: [June 4, 2026, 9:35am UTC](https://discourse.paraview.org/t/center-colourmap-to-zero/17587/6 "2026-06-04T09:35:52Z")
yes you need to change the color transfer function, you can do that in the color map editor (it’s in the advanced property):
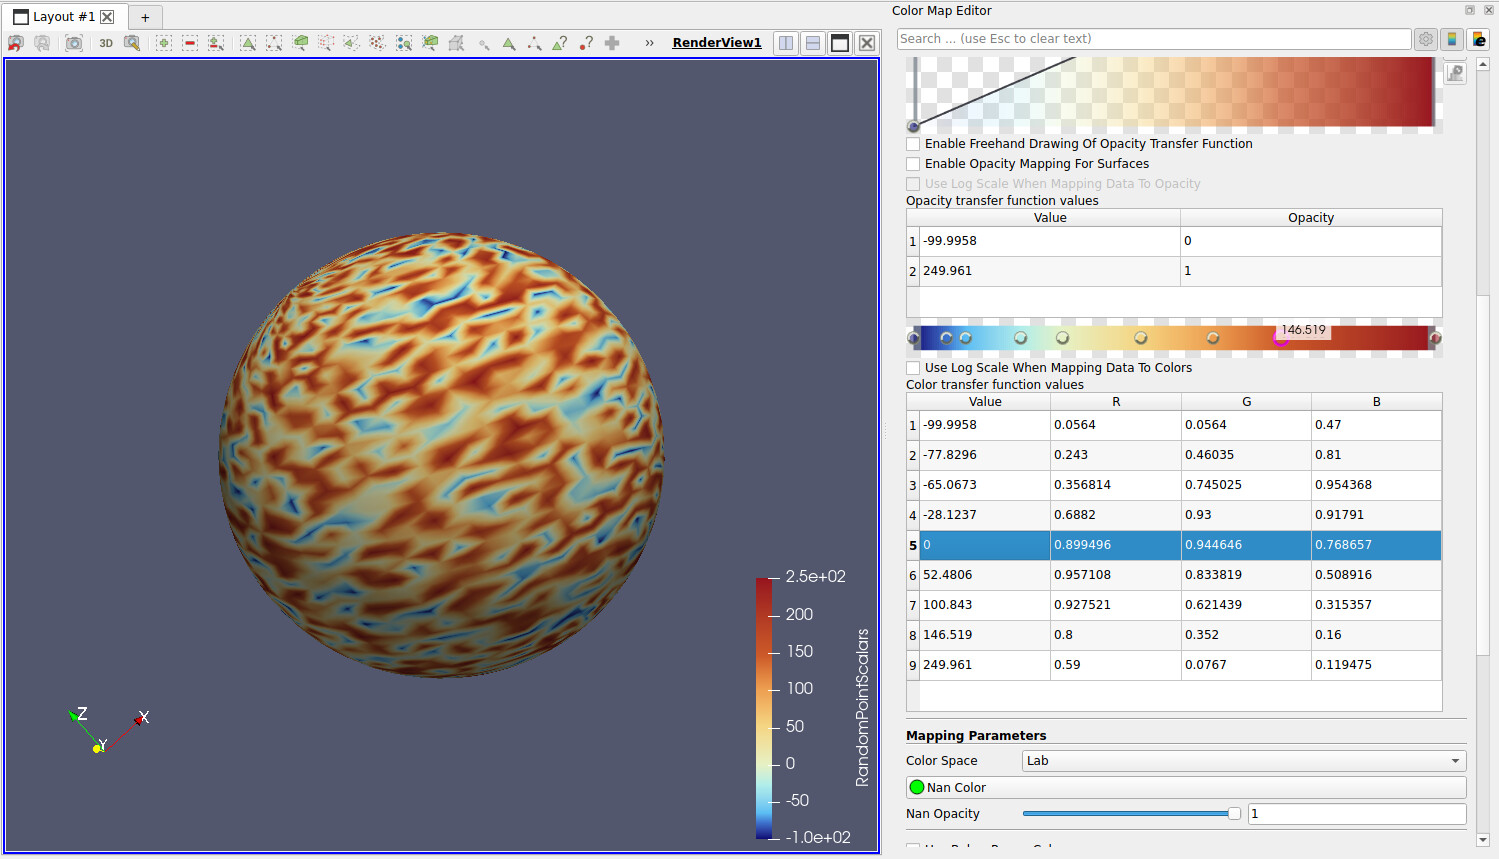
tips: you can copy paste a CTF in this table with ctrl+c if you have the exact same number of row
---
### Author:  [@geacomputing](https://discourse.paraview.org/u/geacomputing)
#### Post date: [June 9, 2026, 5:37pm UTC](https://discourse.paraview.org/t/center-colourmap-to-zero/17587/7 "2026-06-09T17:37:43Z")
Hi there @[Buggs\_Bunny](https://discourse.paraview.org/u/buggs_bunny)
There is usually more than one way to skin a cat.
Another solution could be crafting your own colormap. Paraview can import custom colorbars, in json format. Of course it works the other way around, so you can also export existing ones to inspect and understand.
As a demonstrative example, to that aim, I have exported a standard in-built “FAST” colormap in json format:
```auto
[
{
"ColorSpace" : "Lab",
"Creator" : "Francesca Samsel, and Alan W. Scott",
"DefaultMap" : true,
"Name" : "Fast",
"NanColor" :
[
0.0,
1.0,
0.0
],
"RGBPoints" :
[
0,
0.056399999999999992,
0.056399999999999992,
0.46999999999999997,
0.17159223942480895,
0.24300000000000013,
0.46035000000000043,
0.81000000000000005,
0.29849148183941382,
0.35681438265435211,
0.74502464853631423,
0.95436770289372197,
0.43212873712559069,
0.68820000000000003,
0.93000000000000005,
0.91790999999999989,
0.5,
0.89949595512059022,
0.944646394975174,
0.7686567142818399,
0.58822603531700735,
0.957107977357604,
0.83381851089856662,
0.50891562998421025,
0.70614126056951643,
0.92752075996107142,
0.62143890917391775,
0.31535705838676426,
0.84763953087252719,
0.80000000000000004,
0.35200000000000009,
0.15999999999999998,
1,
0.58999999999999997,
0.076700000000000129,
0.11947499999999994
]
}
]
```
Once you have understood the logic and its architecture, you can create your own, name it, and import it. You can find import and export functionality (button) in the colormap GUI panel selector.
The architecture calls for a flat sequence of scalar value + RBG triplets:
```auto
| Scalar value | R | G | B |
| ------------ | -------- | -------- | -------- |
| 0.000000 | 0.0564 | 0.0564 | 0.4700 |
| 0.171592 | 0.2430 | 0.46035 | 0.8100 |
| 0.298491 | 0.356814 | 0.745025 | 0.954368 |
| 0.432129 | 0.6882 | 0.93 | 0.91791 |
| 0.500000 | 0.899496 | 0.944646 | 0.768657 |
| 0.588226 | 0.957108 | 0.833819 | 0.508916 |
| 0.706141 | 0.927521 | 0.621439 | 0.315357 |
| 0.847640 | 0.8000 | 0.3520 | 0.1600 |
| 1.000000 | 0.5900 | 0.0767 | 0.119475 |
```
The colormap json file goes attached to this message.
Hope this helps.
[test\_colormap\_export.json](https://discourse.paraview.org/uploads/short-url/viCIDx6McDNnmJyFGRPXS24ZVCa.json) (1011 Bytes)
---
### Author:  [@Venke](https://discourse.paraview.org/u/Venke)
#### Post date: [June 10, 2026, 6:11am UTC](https://discourse.paraview.org/t/center-colourmap-to-zero/17587/8 "2026-06-10T06:11:07Z")
When dealing with a lot of datasets it is not practical to create a new colormap for each of them as the min/max values change (and thus the distances from zero to the most positive and most negative values). I guess it would be possible to create a python script performing this automatically but a checkbox for the option to fix the zero color (white in the examples above) to zero and let the blues and reds interpolate to the min/max from there would be most convenient.
---
### Author:  [@Buggs\_Bunny](https://discourse.paraview.org/u/Buggs_Bunny)
#### Post date: [June 10, 2026, 6:45am UTC](https://discourse.paraview.org/t/center-colourmap-to-zero/17587/9 "2026-06-10T06:45:46Z")
@Lucas_Givord Thanks Lucas, if you look at the screenshot I have attached in the question, you can see my colourmap is extremely dense. It is impossible for me to manually change each point and yet keep it smooth
@geacomputing Thanks for that. I have written a python script to make me a new colormap based on the min and max value. I completely agree with @Venke. I have 60 datasets and making a new colourbar for each set is very tedious and confusing.
---
### Author:  [@geacomputing](https://discourse.paraview.org/u/geacomputing)
#### Post date: [June 10, 2026, 7:49am UTC](https://discourse.paraview.org/t/center-colourmap-to-zero/17587/10 "2026-06-10T07:49:33Z")
Hi there.
Yes, I understand. I focused on the actual post title "`Center Colourmap to Zero“`and somehow neglected the problem of having a large number of datasets.
Why don’t you map all your data on the same colormap?
Also, I am attaching the python script I created to generate a custom map. It uses in-built matlplotlib colormaps to build positive and negative sides of the diverging colorbar, allowing to set min, zero, max (attached).
[Diverging\_Colormap.py](https://discourse.paraview.org/uploads/short-url/aZcisvaYqDE9q4C1ySSdZZxQFRO.py) (2.0 KB)
`def export_asymmetric_matplotlib_cmap_to_paraview(`
` output_file=“asymmetric_mpl_colormap.json”,`
` name=“Asymmetric_Matplotlib_Diverging”,`
` vmin=-8.0,`
` vzero=0.0,`
` vmax=2.0,`
` negative_cmap=“Blues_r”,`
` positive_cmap=“Reds”,`
` n_negative=10,`
` n_positive=4,`
` zero_color=(1.0, 1.0, 1.0),`
` color_space=“Lab”,`
`):`
Is there anything preventing you from using 1 colormap for all your 60 datasets?
Or also: create 2 or 3 colormaps (e.g.: Experiment A, Experiment B, Experiment C) and group them accordingly?
---
### Author:  [@Venke](https://discourse.paraview.org/u/Venke)
#### Post date: [June 10, 2026, 8:32am UTC](https://discourse.paraview.org/t/center-colourmap-to-zero/17587/11 "2026-06-10T08:32:07Z")
Being able to directly read min/max from the automatic color scale is a great help in data interpretation. This does not work if you fix the values.
---
### Author:  [@geacomputing](https://discourse.paraview.org/u/geacomputing)
#### Post date: [June 10, 2026, 8:39am UTC](https://discourse.paraview.org/t/center-colourmap-to-zero/17587/12 "2026-06-10T08:39:24Z")
Ah ok. I get it now. Thanks for clarifying.
So what about:
1. you have 60 different dataset.
2. you loop over them all,
3. you compute (and store) min and max and then
4. inject it in the code I have pasted above:
` vmin=-8.0,`
` vmax=2.0,`
This would still assume you have 1 “global” colorbar for all.
However, this start drifting from colorbar manipulation (as per post title) to data I/O preprocessing?