# Change RowID of K-Means Cluster
**URL:** https://discourse.paraview.org/t/change-rowid-of-k-means-cluster/12979
**Category:** ParaView Support
**Created:** [October 3, 2023, 1:58pm UTC](https://discourse.paraview.org/t/change-rowid-of-k-means-cluster/12979 "2023-10-03T13:58:03Z")
**Posts on this page:** 2
**Page:** 1
### Author:  [@jackpoole07](https://discourse.paraview.org/u/jackpoole07)
#### Post date: [October 3, 2023, 1:58pm UTC](https://discourse.paraview.org/t/change-rowid-of-k-means-cluster/12979/1 "2023-10-03T13:58:03Z")
Hello,
I wanted to check regarding the ability to alter assigned Kmeans RowID’s for better Kmeans data visualization. When running Kmeans I end up with a beautiful visualization for electrical resistivity dataset assessed, pictured below.
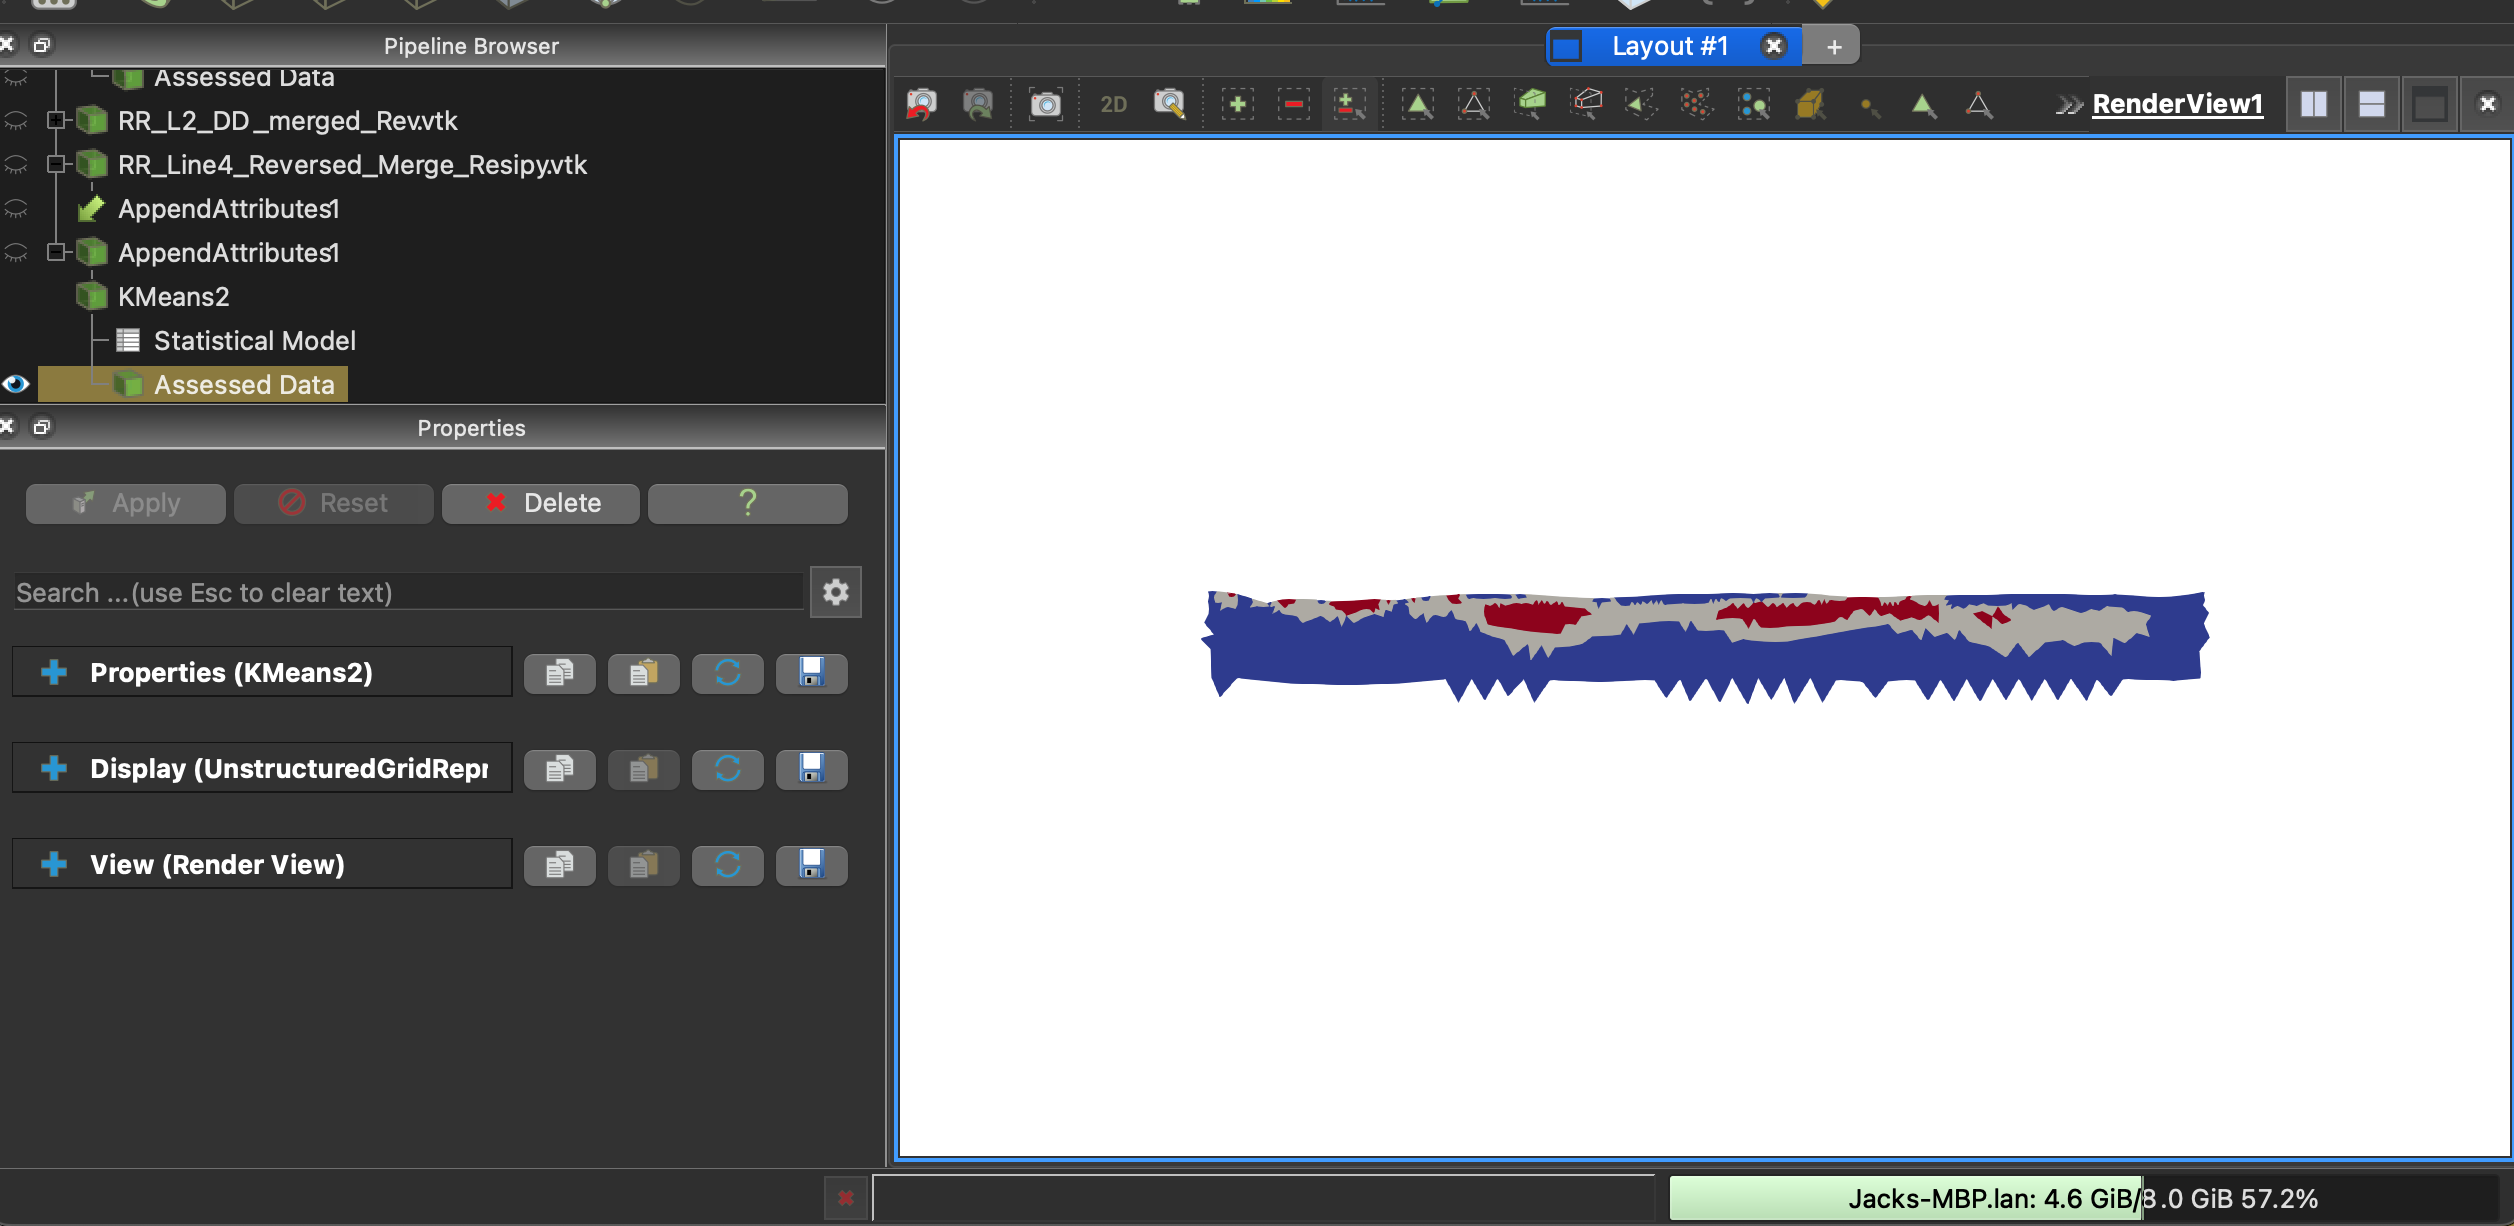
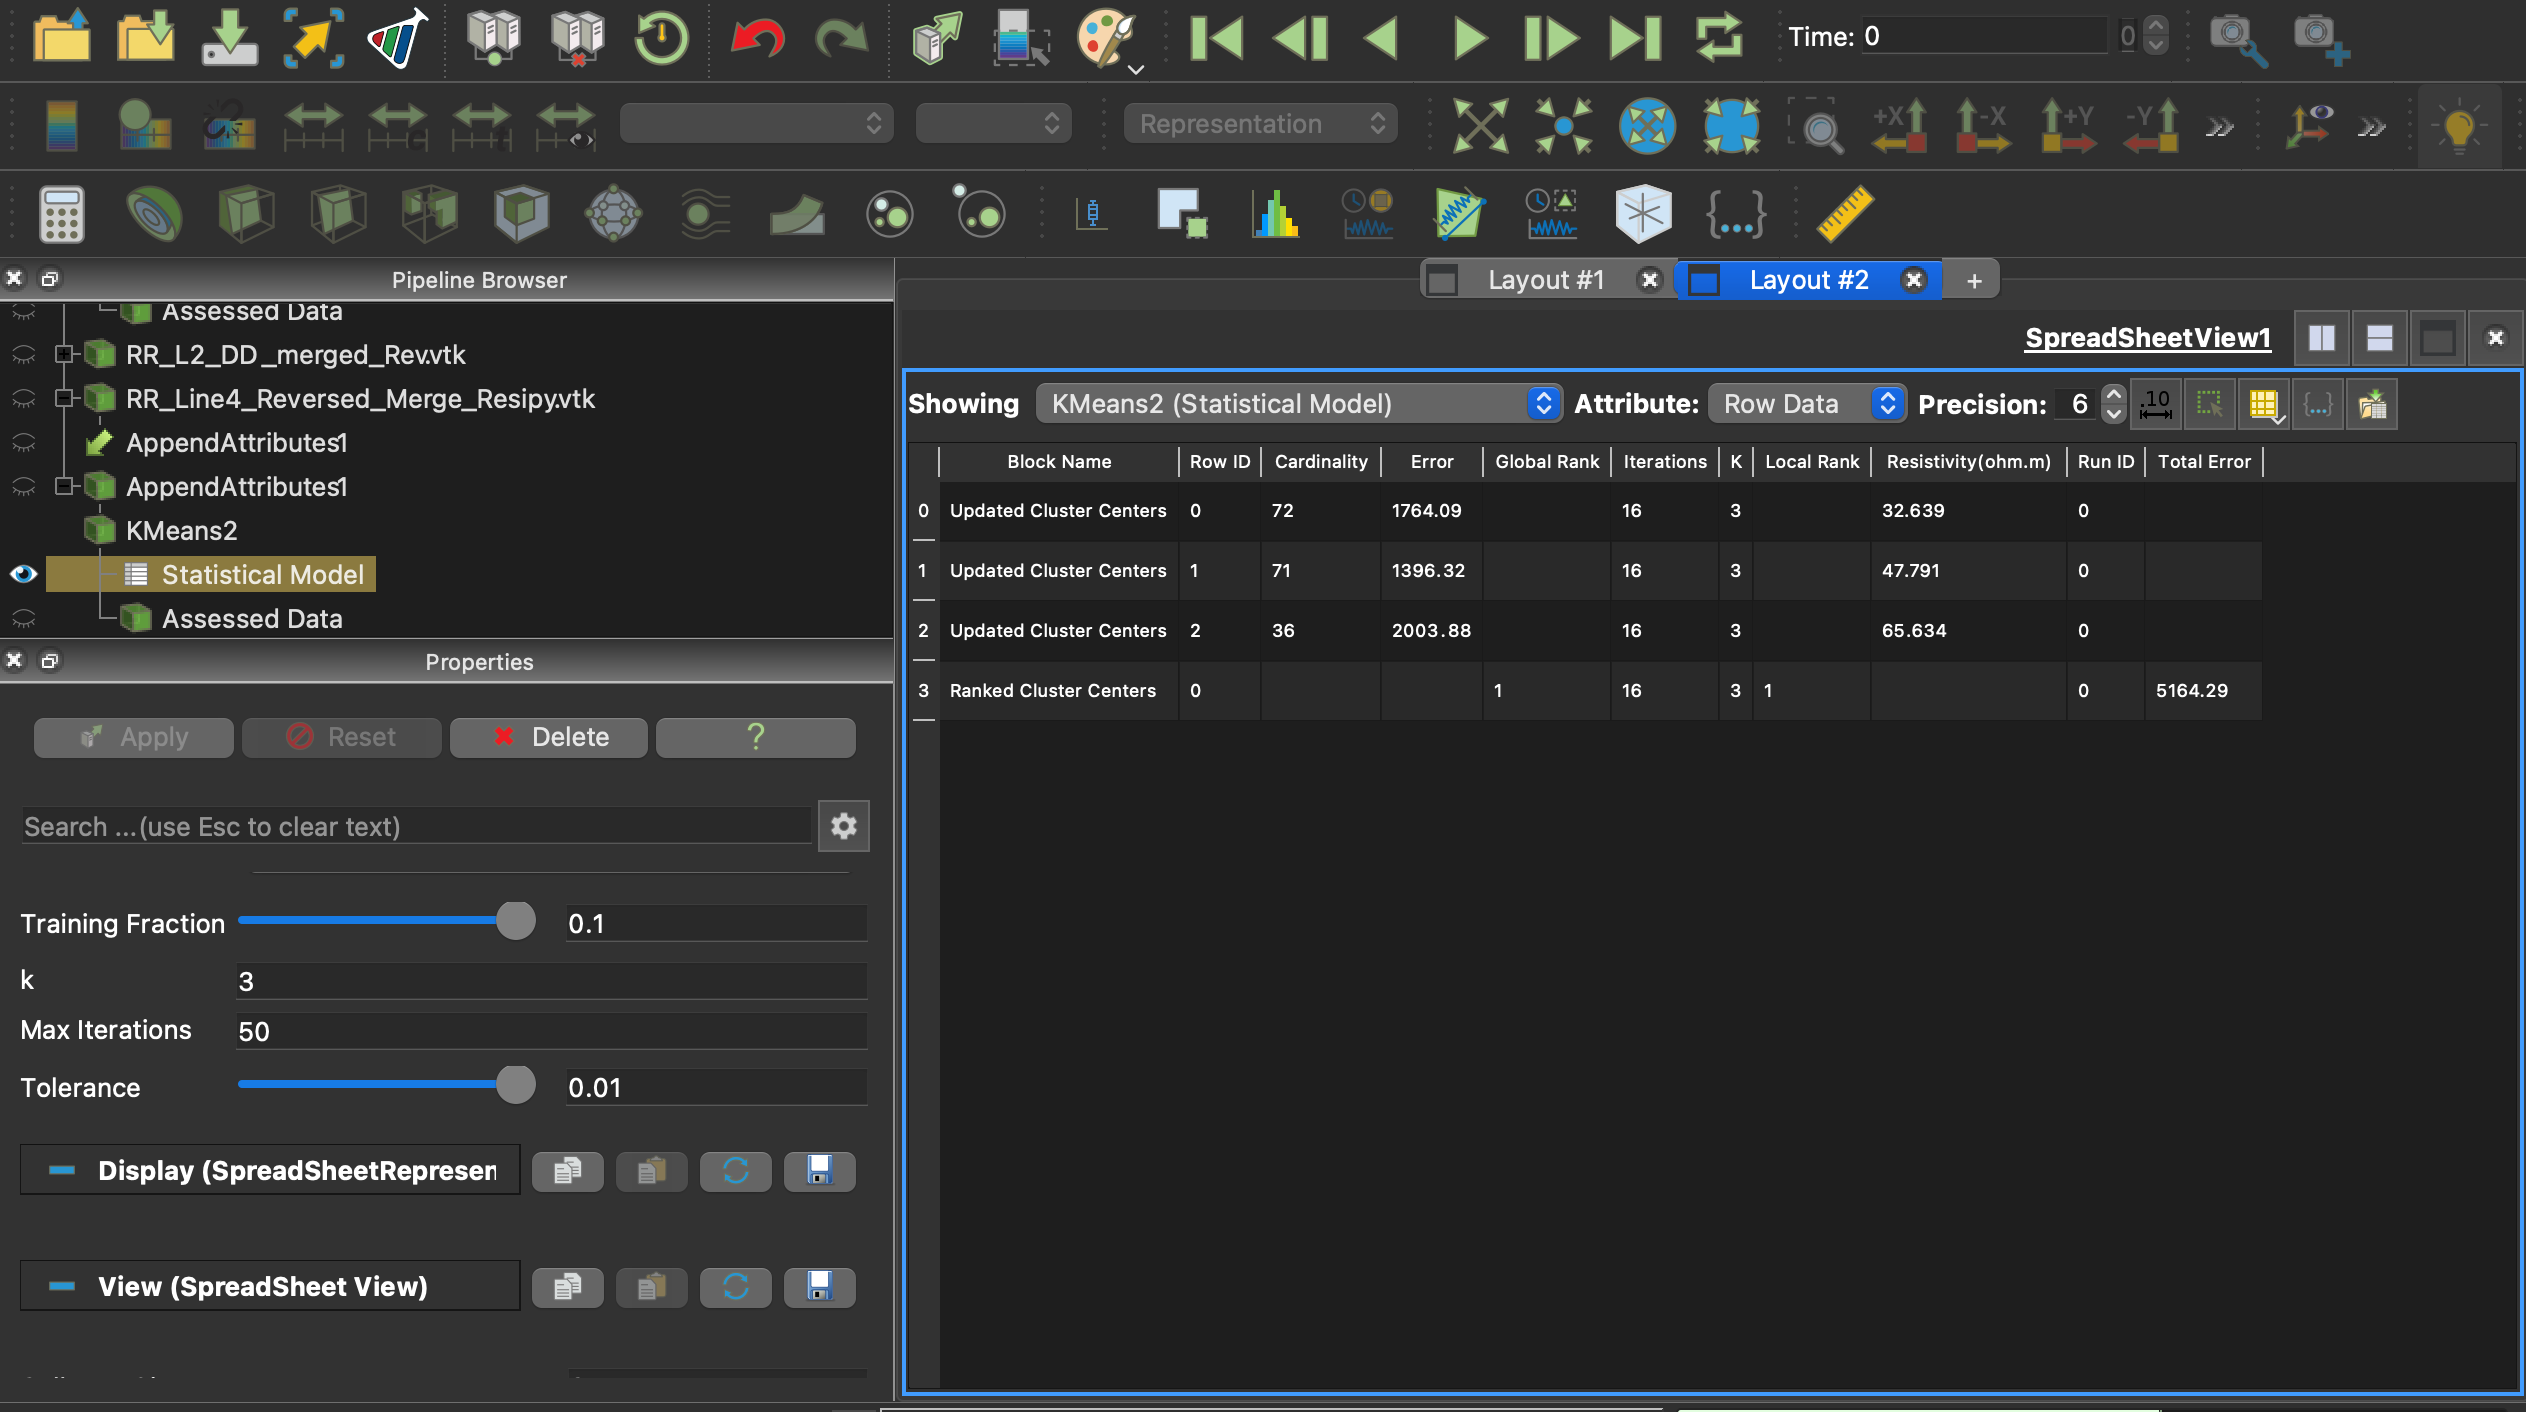
The Kmeans statistical analysis output file is here to assist with interpreting the results. Essentially my K=3 and I have three assigned output clusters in red, grey, and blue. The lowest resistivity cluster is colored blue, middle resistivity in grey, and the highest cluster values in red. RowID
When running this analysis on a second dataset I want to mimic the same clustering colors to match my previous visualization. However when I rerun the Kmeans analysis on the new dataset the output assigns the lowest resistivity cluster to the grey color, with the medium cluster being blue.
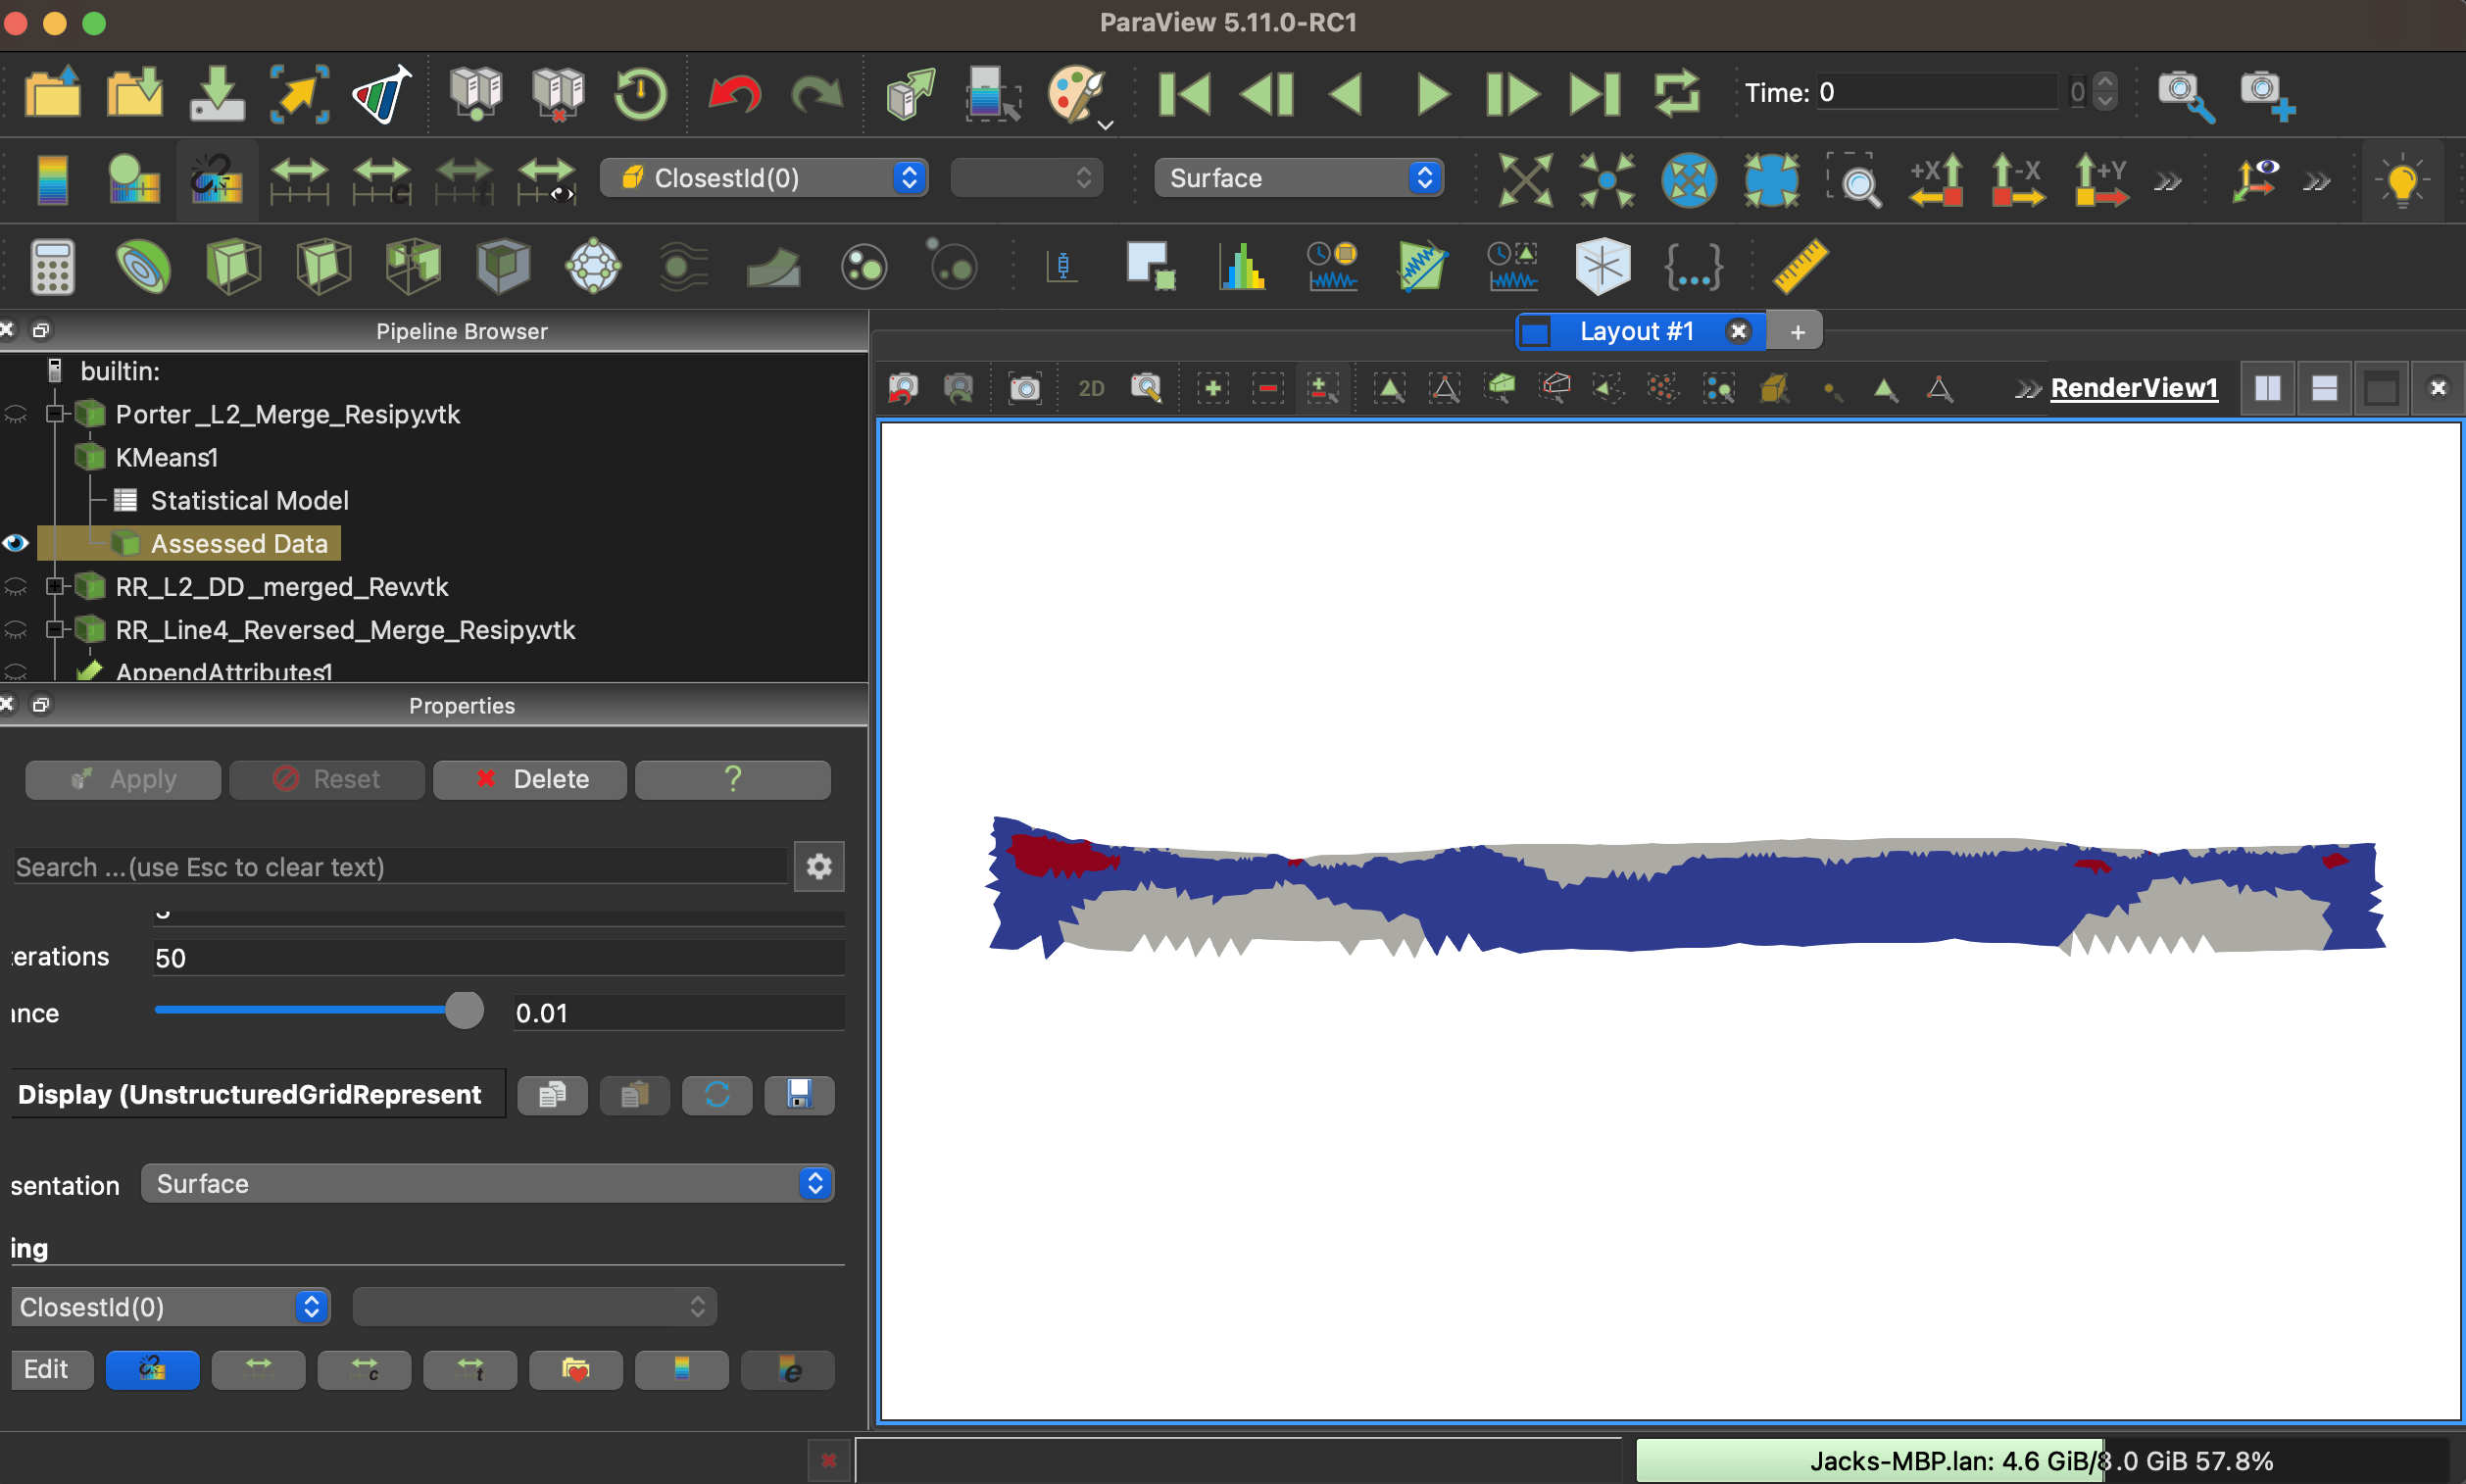
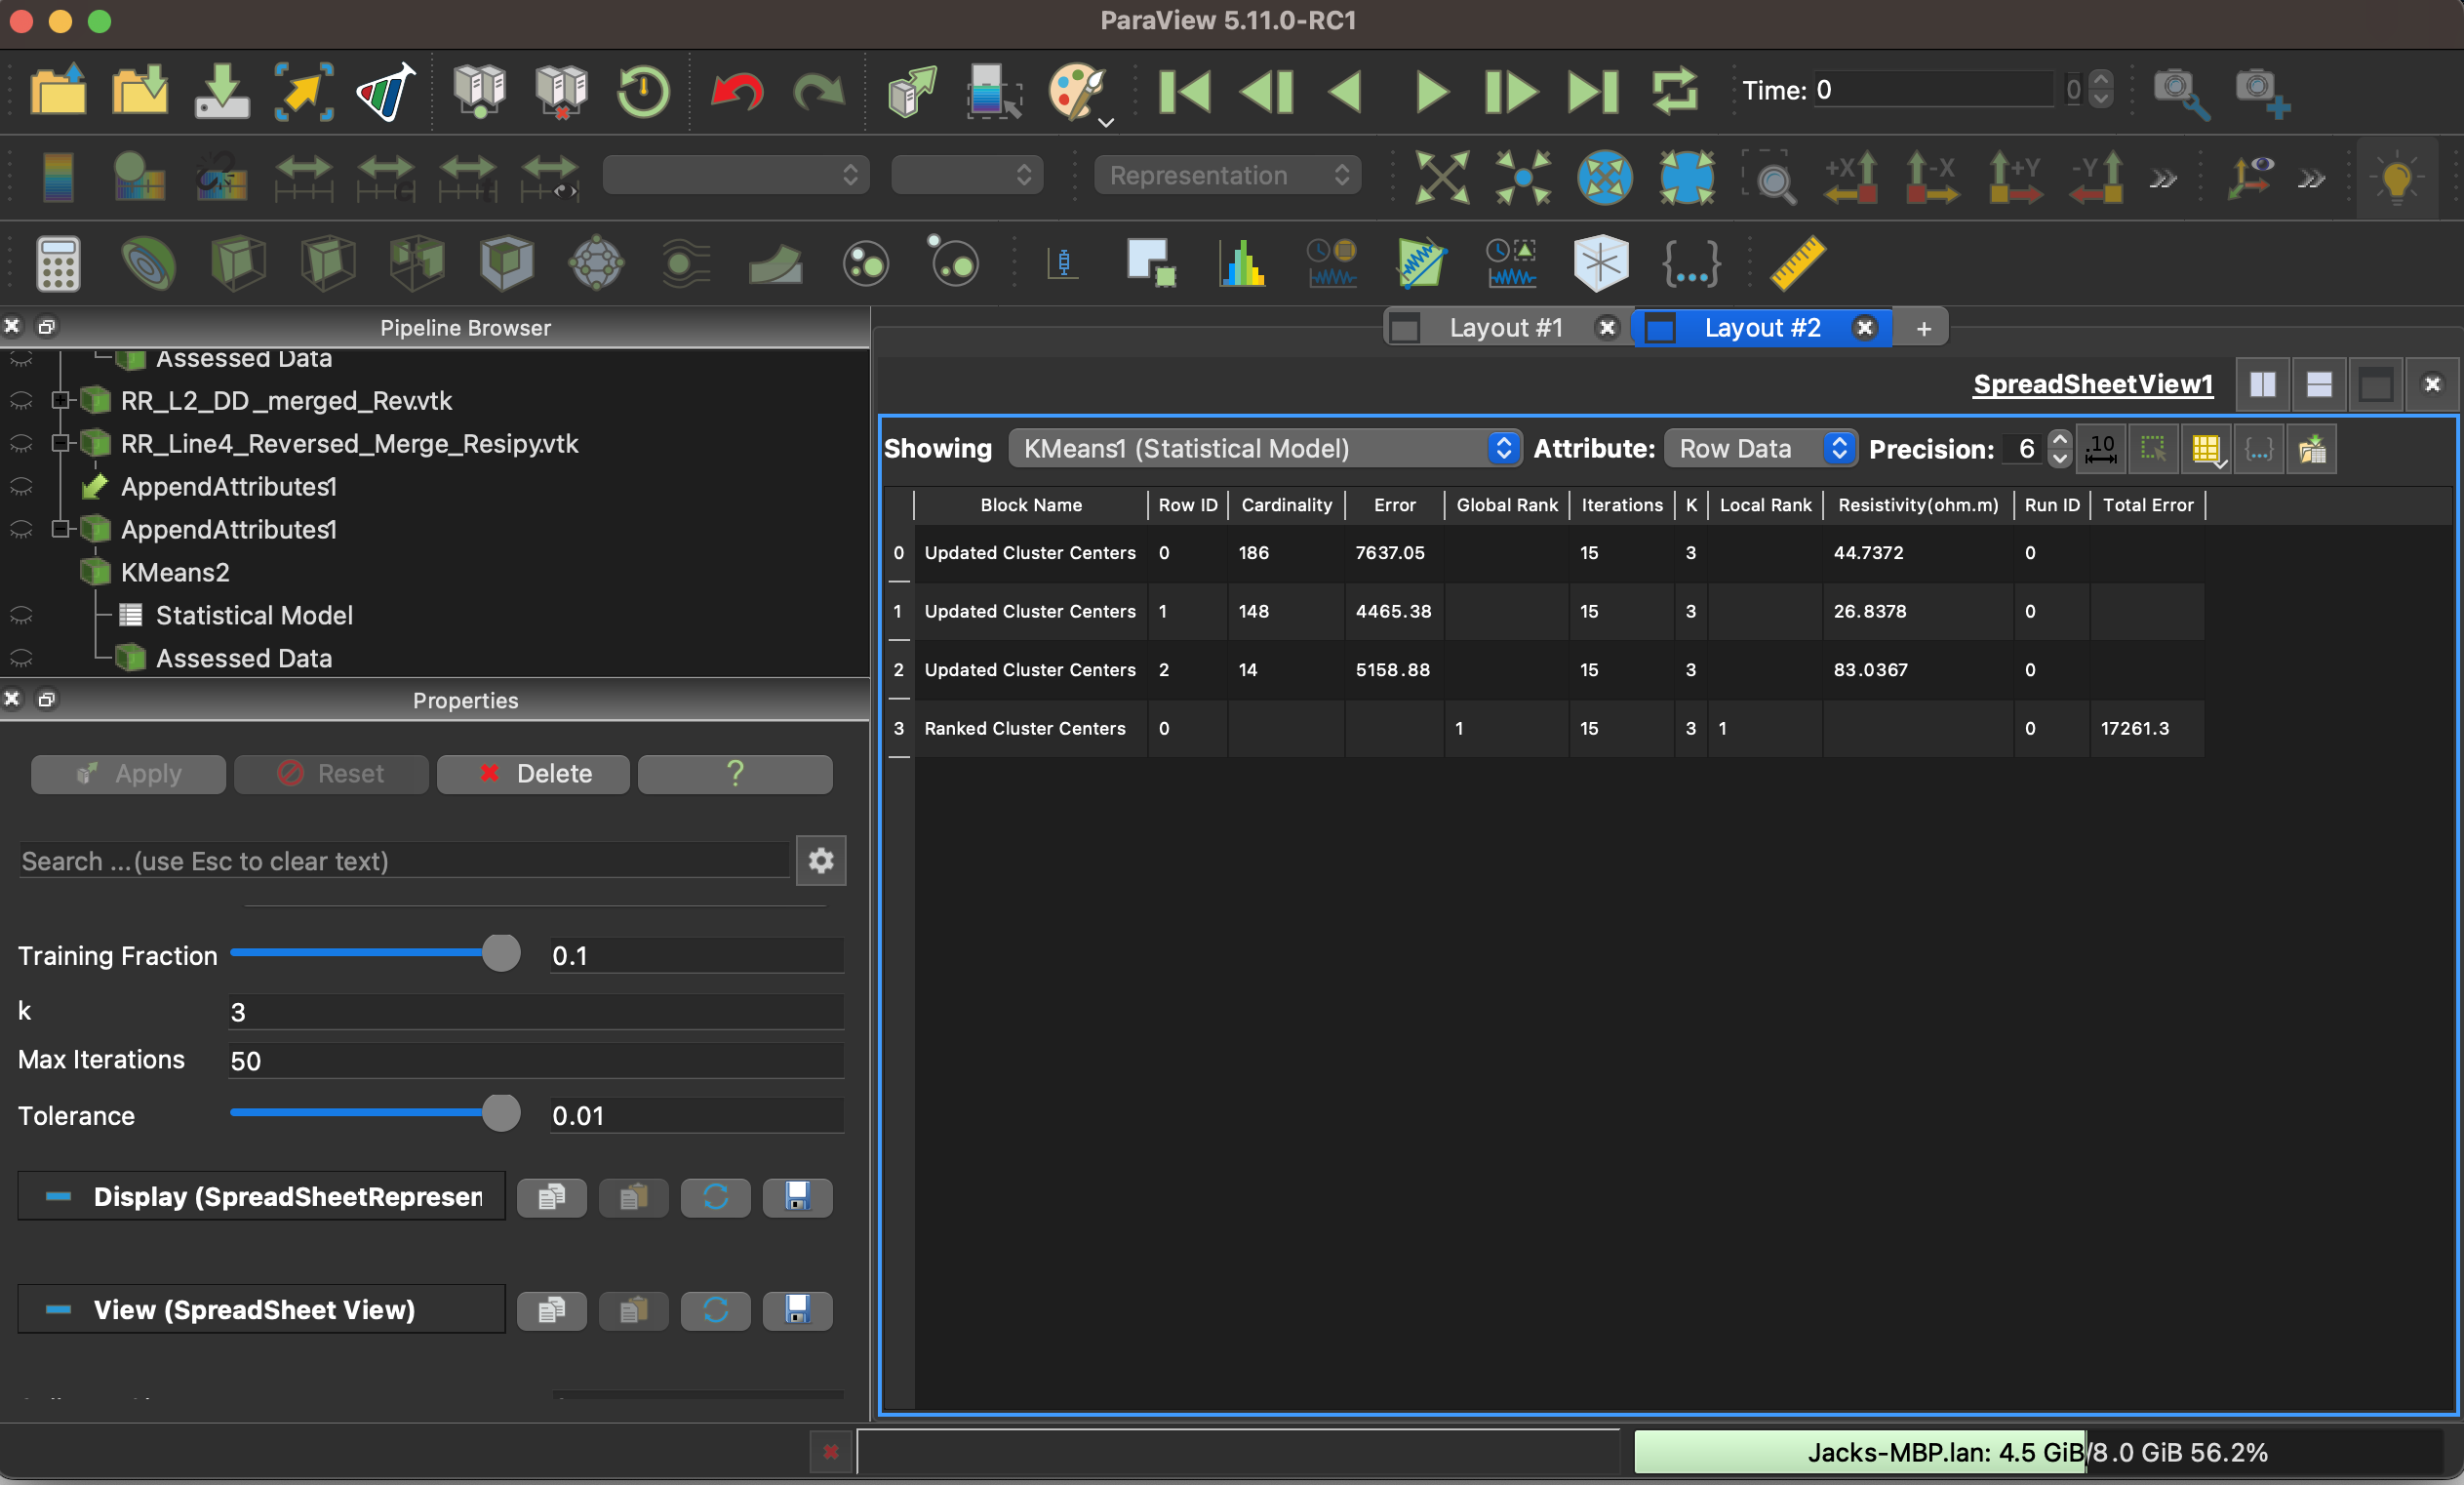
To change the color I would need to switch my RowID so RowID=0 represents my lowest resistivity cluster and RowID=1 represents my second highest resistivity cluster.
Please let me know if you have any solutions for this or if there is a solution for my color map to be changed to reflect the appropriate scaled colors in the results. Thanks for the help!
Best,
Jack
---
### Author:  [@dcthomp](https://discourse.paraview.org/u/dcthomp)
#### Post date: [October 3, 2023, 2:27pm UTC](https://discourse.paraview.org/t/change-rowid-of-k-means-cluster/12979/2 "2023-10-03T14:27:32Z")
@jackpoole07 That is a neat visualization! Unfortunately, there’s not currently an option in the k-means filter to order the clusters. (In general, k-means must work on many-dimensional data, so there is no good rule to order clusters.)
Because the statistics filters can run in stages, you _could_ run K-Means once with the “Task” set to “Model a subset of the data” (or “Detailed model of input data”), then write a Python filter to sort the table rows, and finally run another K-Means filter with the “Task” set to “Assess the data with a model” (using the model with the re-ordered row.)