# ComputeDerivatives filter creates constant vorticity from velocity field - PLOT3D
**URL:** https://discourse.paraview.org/t/computederivatives-filter-creates-constant-vorticity-from-velocity-field-plot3d/5293
**Category:** ParaView Support
**Created:** [September 8, 2020, 5:34pm UTC](https://discourse.paraview.org/t/computederivatives-filter-creates-constant-vorticity-from-velocity-field-plot3d/5293 "2020-09-08T17:34:46Z")
**Posts on this page:** 12
**Page:** 1
### Author:  [@Sangeet](https://discourse.paraview.org/u/Sangeet)
#### Post date: [September 8, 2020, 5:34pm UTC](https://discourse.paraview.org/t/computederivatives-filter-creates-constant-vorticity-from-velocity-field-plot3d/5293/1 "2020-09-08T17:34:46Z")
Hello!
I have a plot3d grid file [plot3dg.bin.xyz](https://discourse.paraview.org/uploads/short-url/VWe0O5B5aBKw4d1phyXKDqQyI.xyz) (25.2 KB) and a plot3d q file [plot3dq.bin.q](https://discourse.paraview.org/uploads/short-url/miEIdqgUpW6LlfA5FiPEyJDYZiR.q) (33.6 KB). I tried to get the vorticity field using the ComputeDerivatives filter and the Gradient of Unstructured Dataset filter, but both result in a vorticity field which is constant or at least it appears constant as the same color is shown throughout the domain. Can anyone help me with what I am doing wrong?
Thank you
---
### Author:  [@Sangeet](https://discourse.paraview.org/u/Sangeet)
#### Post date: [September 10, 2020, 10:30am UTC](https://discourse.paraview.org/t/computederivatives-filter-creates-constant-vorticity-from-velocity-field-plot3d/5293/2 "2020-09-10T10:30:01Z")
Hello!
Can anyone shed some light on the possible issues?
---
### Author:  [@utkarsh.ayachit](https://discourse.paraview.org/u/utkarsh.ayachit)
#### Post date: [September 10, 2020, 11:44am UTC](https://discourse.paraview.org/t/computederivatives-filter-creates-constant-vorticity-from-velocity-field-plot3d/5293/3 "2020-09-10T11:44:14Z")
- Plot3D reader has option to compute vorticity. I used that and I get a Vorticity array generated without having to use any filter.
- Split view and create histogram view. Show the Plot3D data in this view and then under **Display** properties, choose **VorticityMagnitute**. You see something like this:
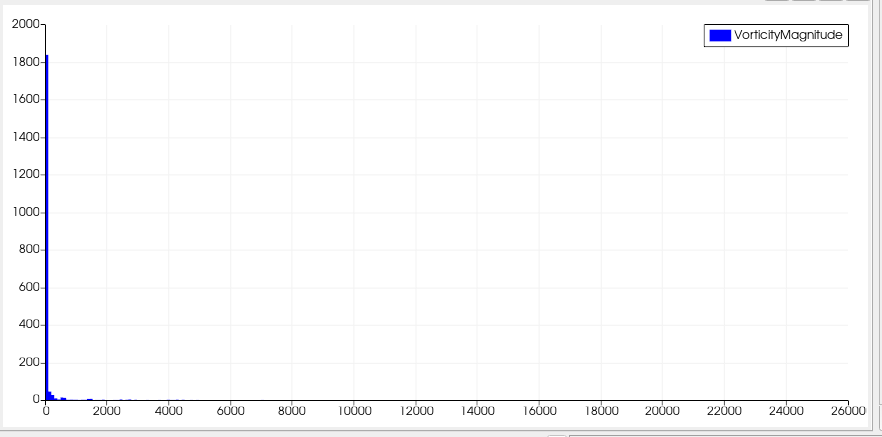
Most of the values are concentrated at the low end.
- To highlight the high-vorticity regions, use Find Data dialog with following setup:
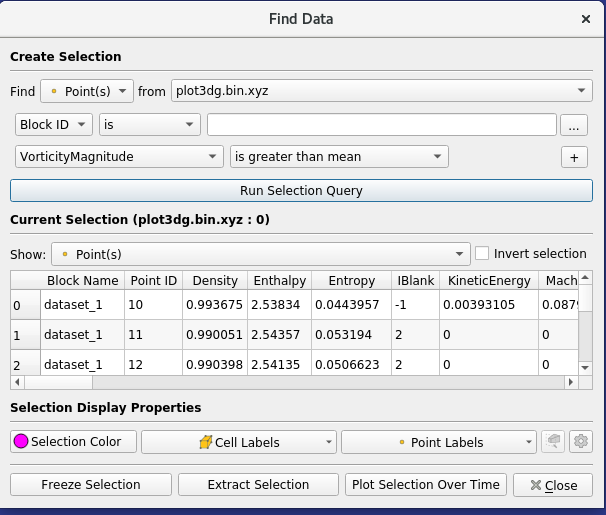
When you hit **Run Selection Query** , the render view will show a small sliver selected:
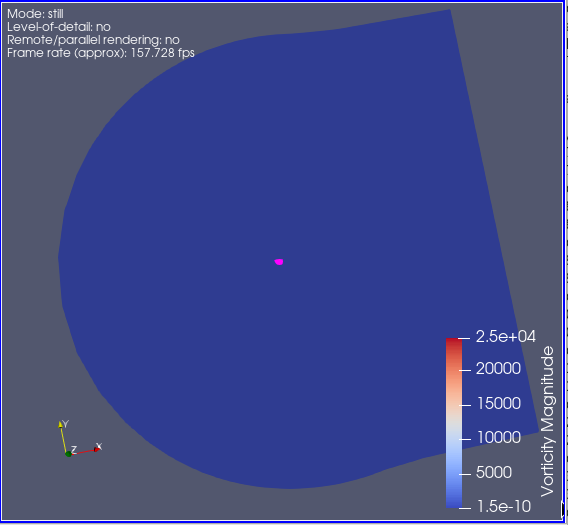
That’s the region greater than “mean” voritcity which is too small to show and interesting color variation.
Hope that helps.
---
### Author:  [@Sangeet](https://discourse.paraview.org/u/Sangeet)
#### Post date: [September 11, 2020, 7:17am UTC](https://discourse.paraview.org/t/computederivatives-filter-creates-constant-vorticity-from-velocity-field-plot3d/5293/4 "2020-09-11T07:17:51Z")
Thanks a lot for such a detailed answer!
---
### Author:  [@Sangeet](https://discourse.paraview.org/u/Sangeet)
#### Post date: [September 11, 2020, 11:31am UTC](https://discourse.paraview.org/t/computederivatives-filter-creates-constant-vorticity-from-velocity-field-plot3d/5293/5 "2020-09-11T11:31:52Z")
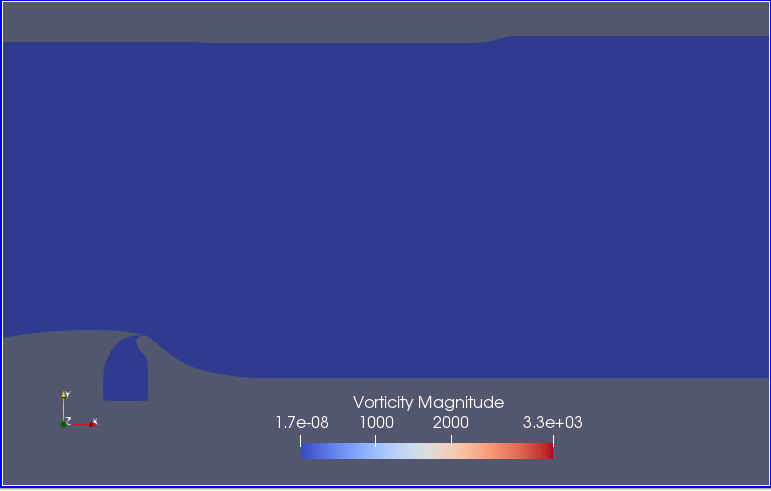
I tried to run a case where I do have an appreciable region of vorticity [plot3dg.bin.xyz](https://discourse.paraview.org/uploads/short-url/jxKOfsmB3Smvw44paEKZmm6SOkn.xyz) (620.6 KB),[plot3dq.bin.q](https://discourse.paraview.org/uploads/short-url/qamNDcOPMZfJpnMTeUZZWCLfPT2.q) (827.6 KB) and I tried your method and got this
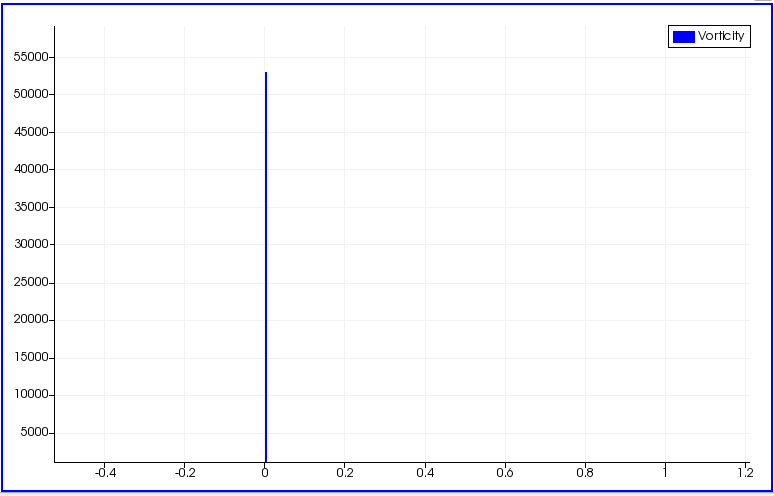
and this
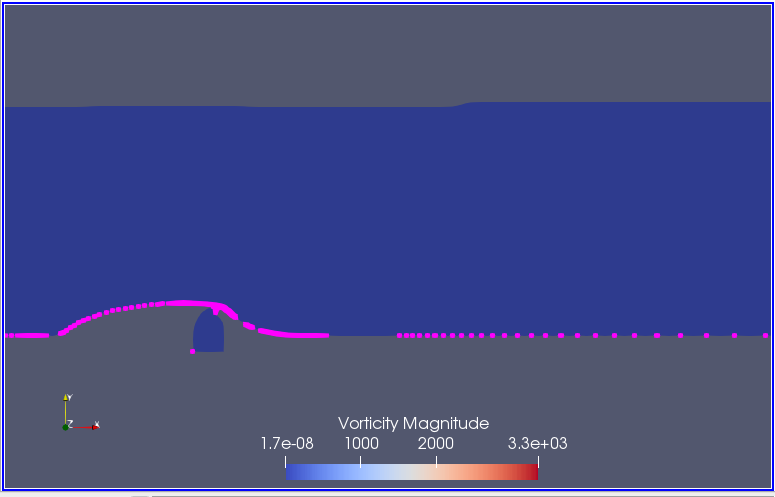
But, I should have appreciable vorticity as the correct result is
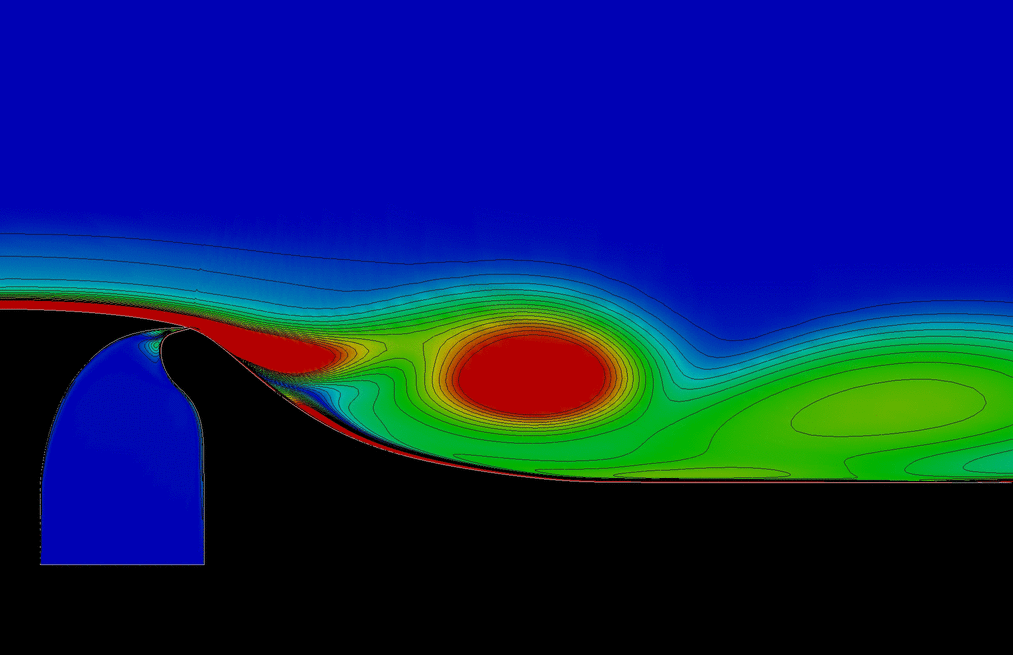
but I get,
---
### Author:  [@utkarsh.ayachit](https://discourse.paraview.org/u/utkarsh.ayachit)
#### Post date: [September 11, 2020, 1:51pm UTC](https://discourse.paraview.org/t/computederivatives-filter-creates-constant-vorticity-from-velocity-field-plot3d/5293/6 "2020-09-11T13:51:14Z")
cc: @berkgeveci, any ideas what’s going on? I am not sure if there’s a bug in the vorticity computation or something else.
---
### Author:  [@Kenneth\_Moreland](https://discourse.paraview.org/u/Kenneth_Moreland)
#### Post date: [September 11, 2020, 2:04pm UTC](https://discourse.paraview.org/t/computederivatives-filter-creates-constant-vorticity-from-velocity-field-plot3d/5293/7 "2020-09-11T14:04:35Z")
This could be a scaling issue. Perhaps there are parts of the mesh (like on boundaries and pinch points) where the Vorticity gets unnaturally big due to, say, a small or degenerate cell. Maybe the color bar needs to be scaled with the maximum more like 100 rather than 3000. Or maybe the colors need to have log scaling. It would help if @Sangeet’s correct example had a scalar bar to show the scaling used there.
---
### Author:  [@Sangeet](https://discourse.paraview.org/u/Sangeet)
#### Post date: [September 11, 2020, 4:31pm UTC](https://discourse.paraview.org/t/computederivatives-filter-creates-constant-vorticity-from-velocity-field-plot3d/5293/8 "2020-09-11T16:31:18Z")
I changed the upper limit to 1.00 instead of 3000. I do see some structure but why is this happening? I assumed that Paraview would automatically choose the appropriate min-max values.
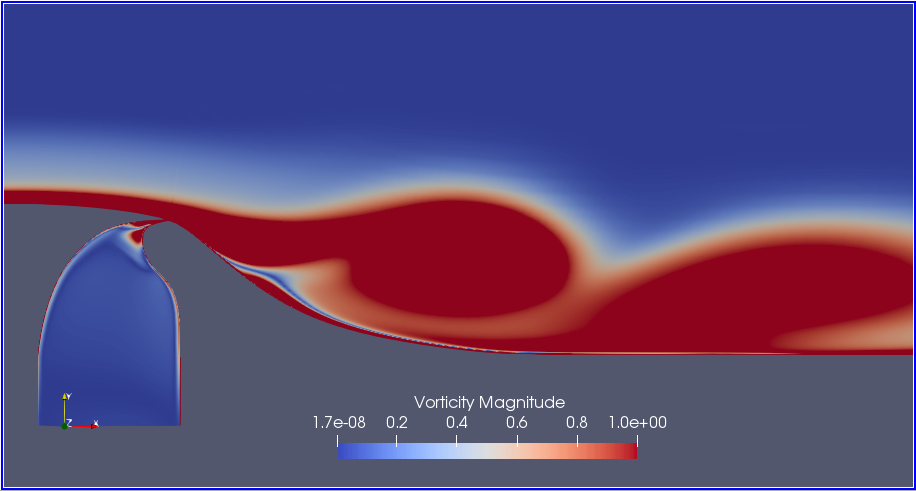
And it seems changing the min-max values greatly affects visualization, how should i decide on what values to choose?
---
### Author:  [@Kenneth\_Moreland](https://discourse.paraview.org/u/Kenneth_Moreland)
#### Post date: [September 11, 2020, 9:47pm UTC](https://discourse.paraview.org/t/computederivatives-filter-creates-constant-vorticity-from-velocity-field-plot3d/5293/9 "2020-09-11T21:47:28Z")
ParaView simply finds the smallest number and the largest number in your field and uses that to scale. My guess is that there is a funny-shaped cell in your data that is throwing off the vortex calculation (with a divide by near-zero), which is creating an unrealistically large value.
---
### Author:  [@Sangeet](https://discourse.paraview.org/u/Sangeet)
#### Post date: [September 12, 2020, 6:36am UTC](https://discourse.paraview.org/t/computederivatives-filter-creates-constant-vorticity-from-velocity-field-plot3d/5293/10 "2020-09-12T06:36:07Z")
So, I tried to see if the max vorticity was due to a bad cell or not. I used “Find Data” to find the location of maximum vorticity magnitude.
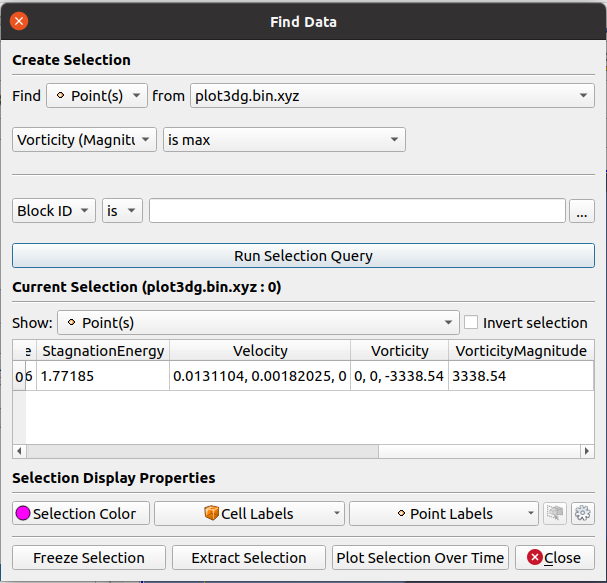
Then I got this
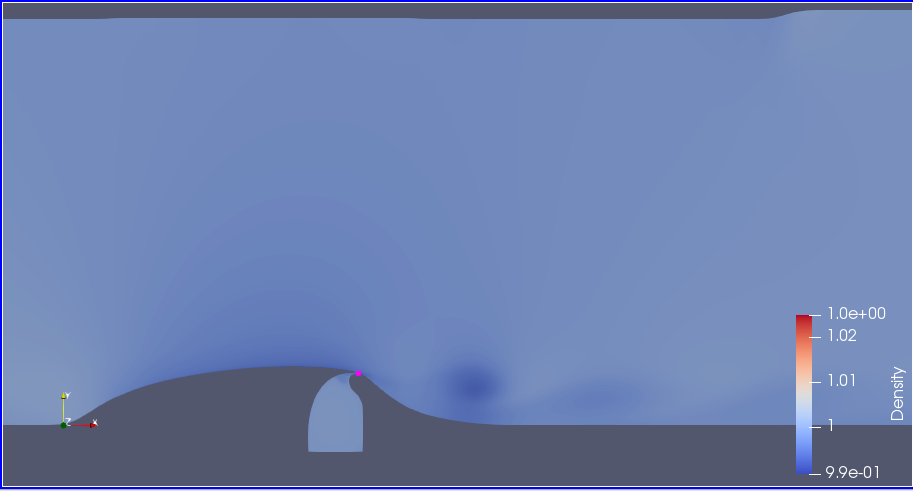
But when I zoom in, with edges ON, I get
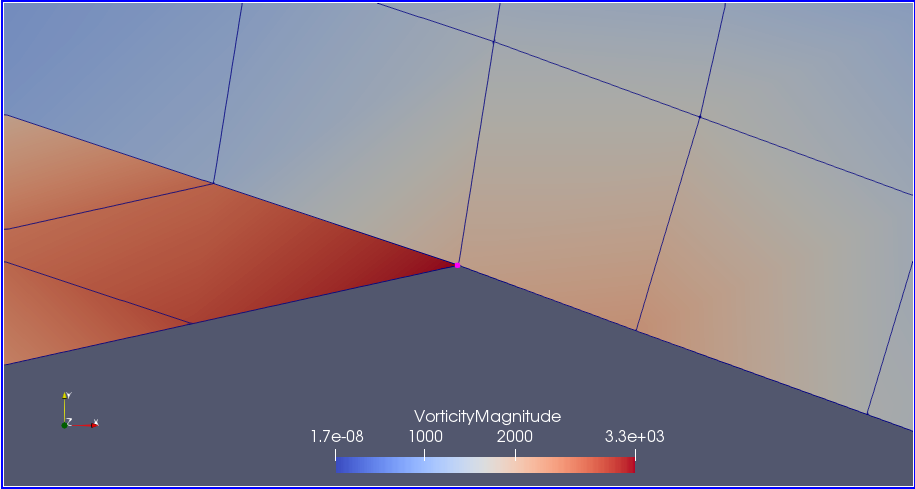
This doesn’t seem like a bad cell to me.
---
### Author:  [@Sangeet](https://discourse.paraview.org/u/Sangeet)
#### Post date: [September 12, 2020, 1:33pm UTC](https://discourse.paraview.org/t/computederivatives-filter-creates-constant-vorticity-from-velocity-field-plot3d/5293/11 "2020-09-12T13:33:52Z")
I checked with others in my research group and they have the same problem. This grid is from NASA CFL3D website and my colleague generated his own grid from ICEM CFD, both are having this scaling problem for vorticity and the cells are all normal.
---
### Author:  [@Sangeet](https://discourse.paraview.org/u/Sangeet)
#### Post date: [September 15, 2020, 2:07pm UTC](https://discourse.paraview.org/t/computederivatives-filter-creates-constant-vorticity-from-velocity-field-plot3d/5293/12 "2020-09-15T14:07:39Z")
Could you confirm if this is indeed mesh issue or not?
Thank you