# Converting .csv Files to 3D Plots (stuck!!)
**URL:** https://discourse.paraview.org/t/converting-csv-files-to-3d-plots-stuck/7560
**Category:** ParaView Support
**Created:** [July 6, 2021, 3:33pm UTC](https://discourse.paraview.org/t/converting-csv-files-to-3d-plots-stuck/7560 "2021-07-06T15:33:44Z")
**Posts on this page:** 20
**Page:** 1
### Author:  [@eb1064](https://discourse.paraview.org/u/eb1064)
#### Post date: [July 6, 2021, 3:33pm UTC](https://discourse.paraview.org/t/converting-csv-files-to-3d-plots-stuck/7560/1 "2021-07-06T15:33:44Z")
I have multiple .csv files that I need to convert in ParaView. I have followed the following steps:
- Open your .csv file, Apply
- Filter → Table to points
- Set X to x, Y to y, Z to z, Apply
- Filter → Delaunay 3D, Apply
But ParaView gets stuck and crashes when I apply the Delaunay 3D filter. This is likely because my .csv is so large.
One .csv file that is 262,145 rows long took about 10 minutes to apply the Delaunay 3D filter. I have two more .csv files that are 2,097,151 rows and 16,777,215 rows long. Both are getting stuck and crashing after 5 HOURS. Is there some way I can automatically convert the .csv to an .xdmf or some other ParaView file? Or at least a quicker way??
Thanks,
Elise
---
### Author:  [@cory.quammen](https://discourse.paraview.org/u/cory.quammen)
#### Post date: [July 6, 2021, 4:22pm UTC](https://discourse.paraview.org/t/converting-csv-files-to-3d-plots-stuck/7560/2 "2021-07-06T16:22:33Z")
Are the points arranged regularly into a grid by chance? If so, then the **Table to Structured Grid** filter would be much faster than **Delaunay 3D**.
---
### Author:  [@eb1064](https://discourse.paraview.org/u/eb1064)
#### Post date: [July 6, 2021, 4:32pm UTC](https://discourse.paraview.org/t/converting-csv-files-to-3d-plots-stuck/7560/3 "2021-07-06T16:32:56Z")
Hi Cory,
Thanks for the quick reply. Do you mean using **Table to Structured Grid** instead of **Table to Points**? Or using **Table to Points** then **Table to Structured Grid**? After using **Table to Structured Grid** , how do I view it in 3D?
Honestly, I am not sure if my points are arranged into a grid. I am relatively new to excel. How do I check this?
---
### Author:  [@cory.quammen](https://discourse.paraview.org/u/cory.quammen)
#### Post date: [July 6, 2021, 5:27pm UTC](https://discourse.paraview.org/t/converting-csv-files-to-3d-plots-stuck/7560/4 "2021-07-06T17:27:08Z")
> [@eb1064](#):
>
> Do you mean using **Table to Structured Grid** instead of **Table to Points**?
Yes, that is what I meant.
> [@eb1064](#):
>
> After using **Table to Structured Grid** , how do I view it in 3D?
The outer surface of the structured grid will be displayed as a solid surface by default.
What is your end goal? Do you want to see the X, Y, Z points in space? Or are you trying to create an unstructured grid from the points (that’s what **Delaunay 3D** does).
---
### Author:  [@eb1064](https://discourse.paraview.org/u/eb1064)
#### Post date: [July 6, 2021, 6:25pm UTC](https://discourse.paraview.org/t/converting-csv-files-to-3d-plots-stuck/7560/5 "2021-07-06T18:25:08Z")
Hi Cory,
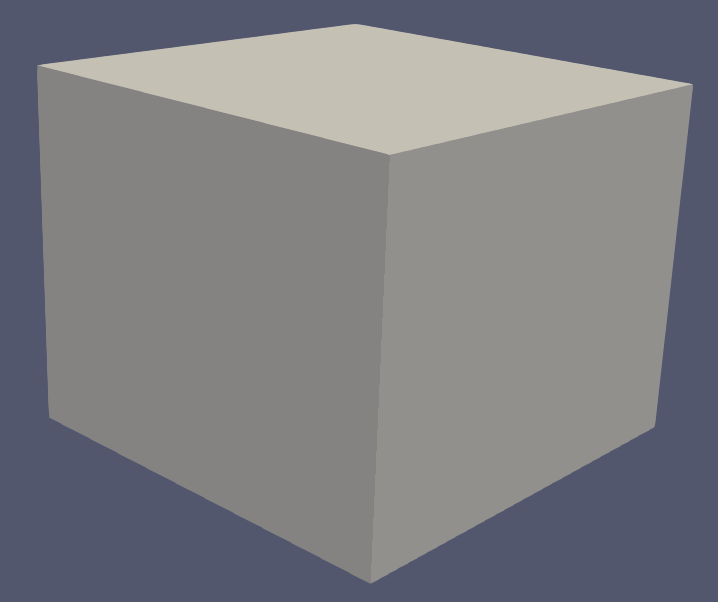
My end goal is to produce an image like the one shown below. I have the x, y, and z coordinates in a .csv file that I need converted to a 3D image.
---
### Author:  [@cory.quammen](https://discourse.paraview.org/u/cory.quammen)
#### Post date: [July 6, 2021, 6:43pm UTC](https://discourse.paraview.org/t/converting-csv-files-to-3d-plots-stuck/7560/6 "2021-07-06T18:43:24Z")
In that case, **Table to Structured Grid** should work, as long as your input XYZ points are ordered in a way such that they trace through lines of the grid structure systematically first along one dimension, then the next, then the third.
Set the **Whole Extent** to
0, nx-1
0, ny-1
0, nz-1
where nx, ny, and nz are the dimensions of your grid in the CSV file. Then choose the X Column array, Y Column array, and Z Column array to be the matching column from the CSV file.
---
### Author:  [@eb1064](https://discourse.paraview.org/u/eb1064)
#### Post date: [July 6, 2021, 7:00pm UTC](https://discourse.paraview.org/t/converting-csv-files-to-3d-plots-stuck/7560/7 "2021-07-06T19:00:20Z")
Hi Cory,
This is a screenshot of my window:
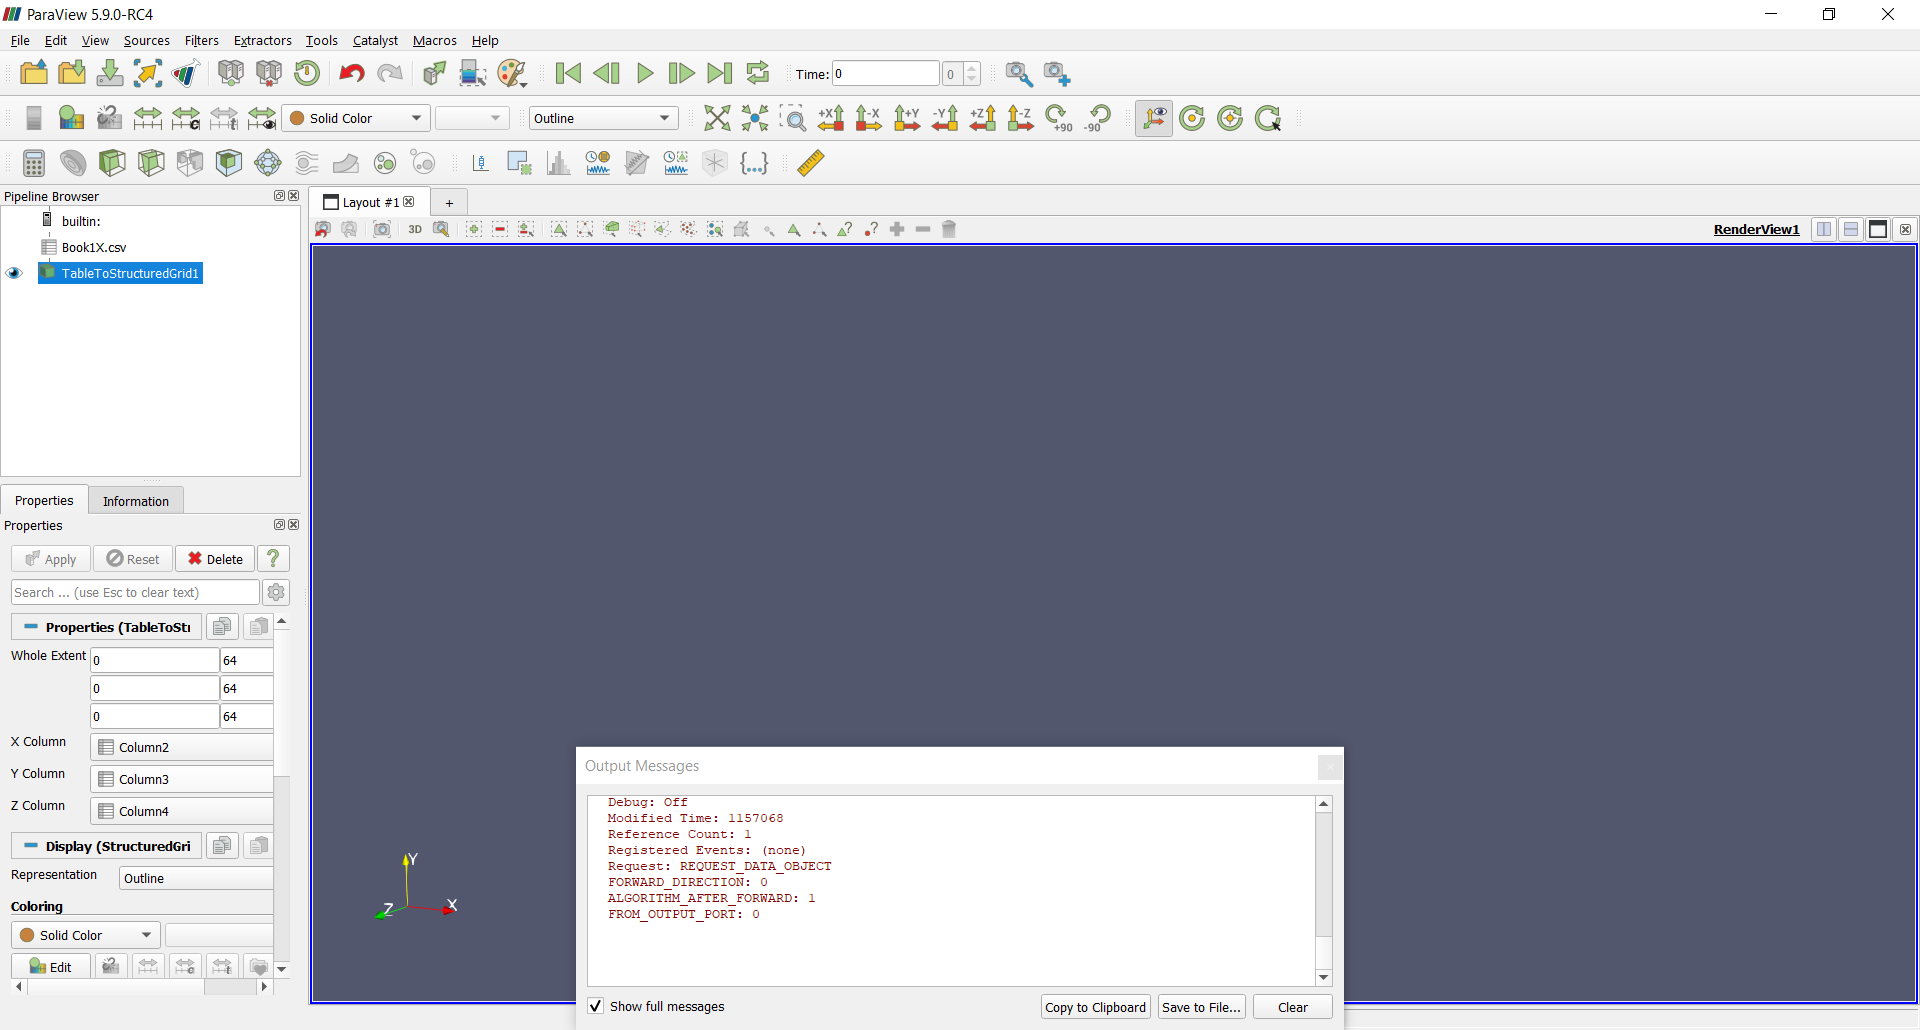
I uploaded the .csv, and then used **Table to Structured Grid** with **Whole Extent** to 0-64 for each of the directions, as well as setting the columns properly. Nothing is showing up. Do I need another filter, too?
---
### Author:  [@utkarsh.ayachit](https://discourse.paraview.org/u/utkarsh.ayachit)
#### Post date: [July 7, 2021, 11:49am UTC](https://discourse.paraview.org/t/converting-csv-files-to-3d-plots-stuck/7560/8 "2021-07-07T11:49:42Z")
If you can share the sample file, it’ll be easy to figure out what’s going on.
---
### Author:  [@eb1064](https://discourse.paraview.org/u/eb1064)
#### Post date: [July 7, 2021, 2:27pm UTC](https://discourse.paraview.org/t/converting-csv-files-to-3d-plots-stuck/7560/9 "2021-07-07T14:27:15Z")
[FILENAME2000.csv](https://discourse.paraview.org/uploads/short-url/2ZRovA95r8Tc1lkWe2Cvsg7xL5M.csv) (173.5 KB)
Here is one of the files that is smaller, only 4096 rows (16^3). The larger one is too large to upload. It is too large to even view in Excel at 2,097,152 rows long (128^3). By the way, I got the **Table to Structured Grid** working, but this is what it looks like:
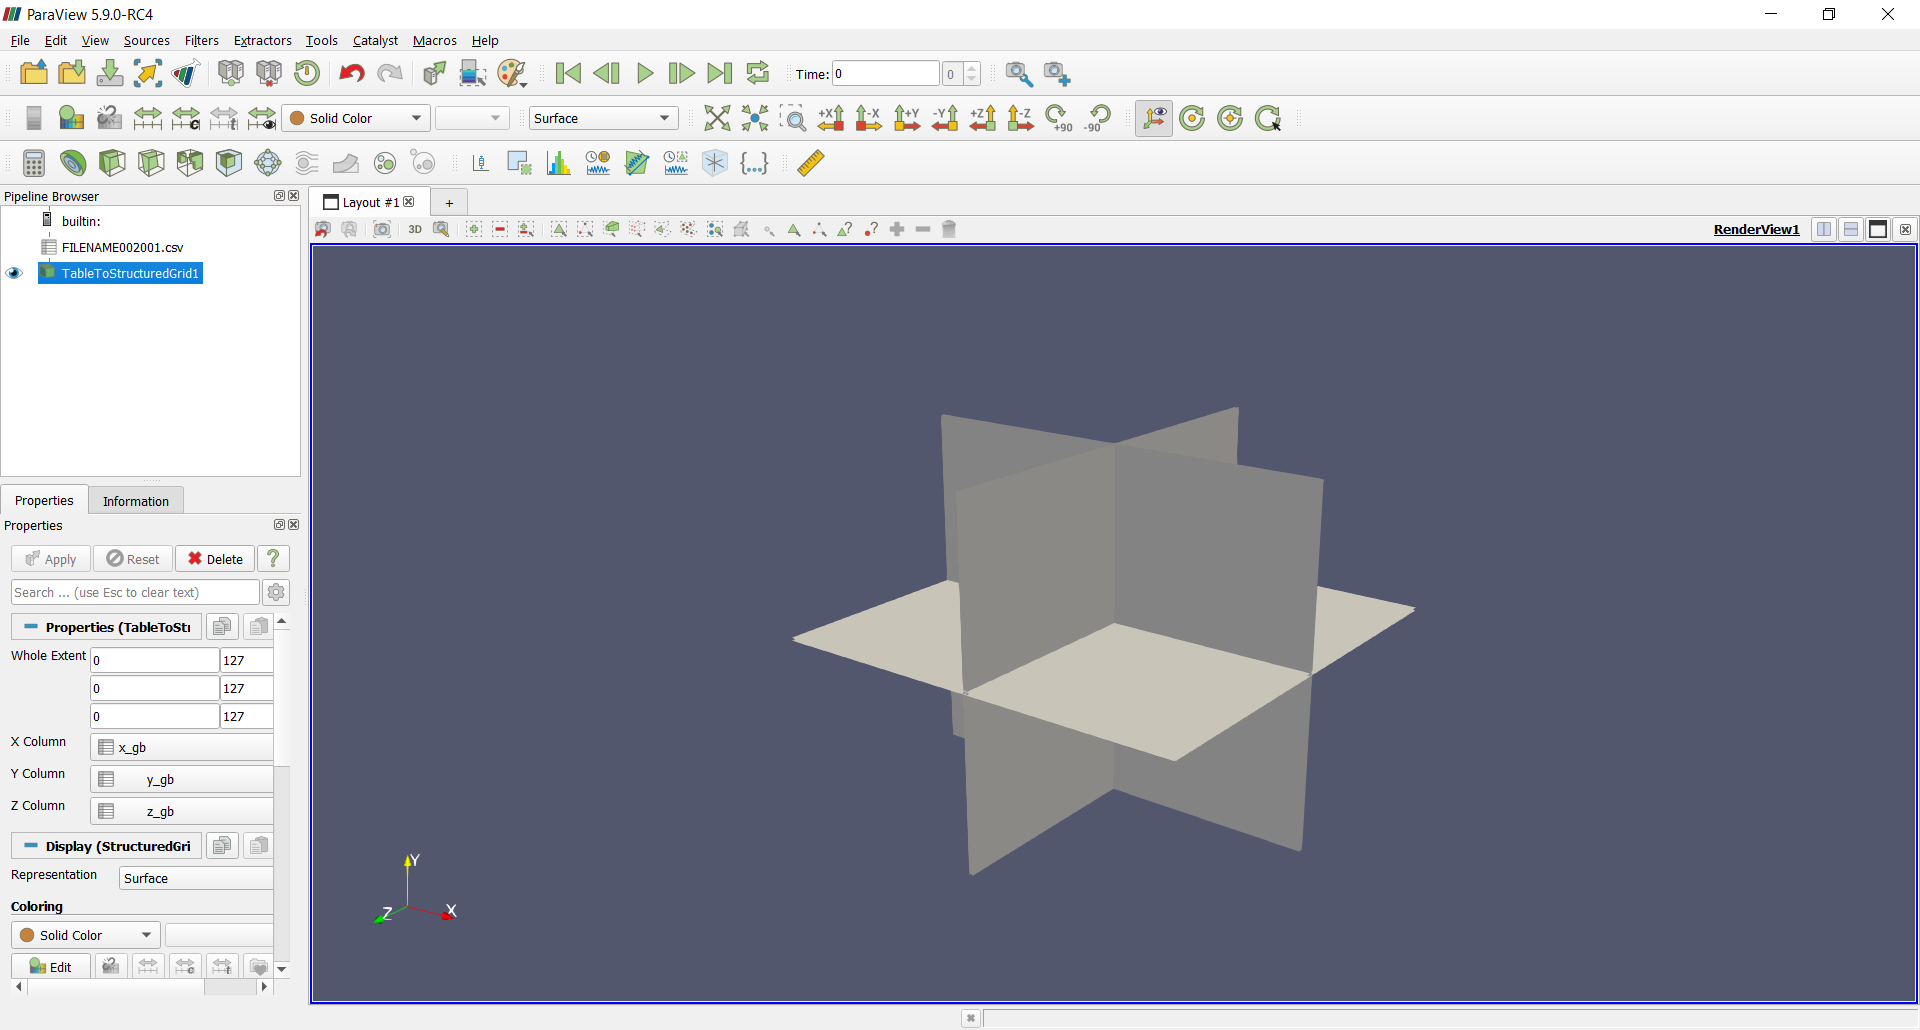
I want it to be a cube, not just show the axes outline. Just to note, it is the larger one that I am having trouble with ParaView. It gets stuck.
---
### Author:  [@utkarsh.ayachit](https://discourse.paraview.org/u/utkarsh.ayachit)
#### Post date: [July 7, 2021, 2:46pm UTC](https://discourse.paraview.org/t/converting-csv-files-to-3d-plots-stuck/7560/10 "2021-07-07T14:46:07Z")
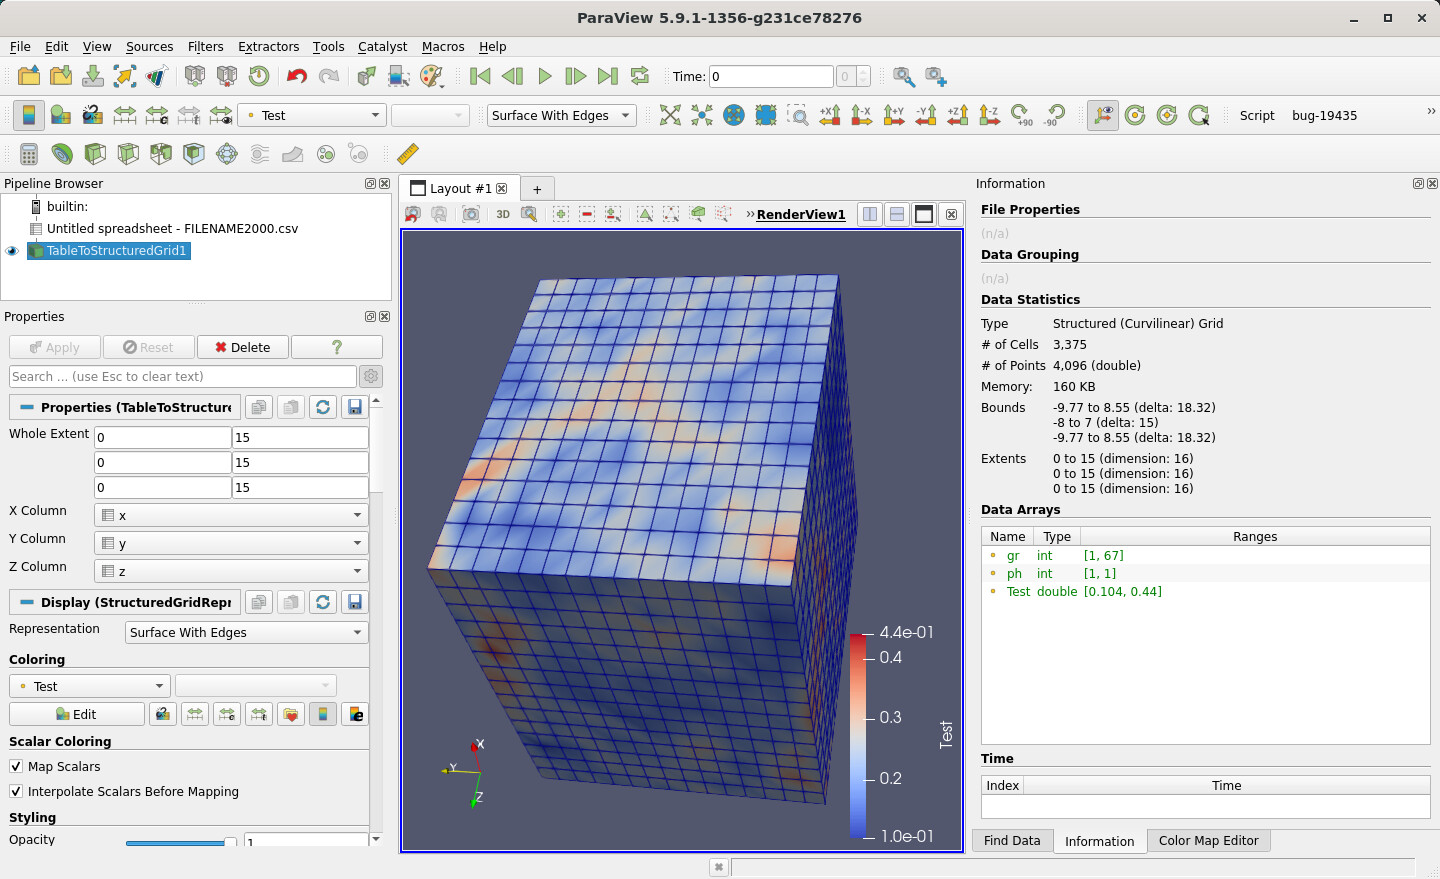
The issue is that rows are not ordered correctly. Attached is the same CSV with columns sorted by x, y and z.
[sorted.csv](https://discourse.paraview.org/uploads/short-url/x6toePzwZvufDl7PFF4hiJgCNYZ.csv) (173.5 KB)
here’s the result:
---
### Author:  [@eb1064](https://discourse.paraview.org/u/eb1064)
#### Post date: [July 7, 2021, 3:45pm UTC](https://discourse.paraview.org/t/converting-csv-files-to-3d-plots-stuck/7560/11 "2021-07-07T15:45:36Z")
Hi Utkarsh,
I just want to double check something, the x, y, and z columns are the coordinates for the voxels (points). These coordinates remain the same, it is just sorted in the x column right? But the corresponding y and z values remain the same?
---
### Author:  [@utkarsh.ayachit](https://discourse.paraview.org/u/utkarsh.ayachit)
#### Post date: [July 7, 2021, 4:27pm UTC](https://discourse.paraview.org/t/converting-csv-files-to-3d-plots-stuck/7560/12 "2021-07-07T16:27:58Z")
yes, unless I messed up using Excel…I don’t use it often, so I’d recommend you generate the sorted version for yourself, correctly.
---
### Author:  [@eb1064](https://discourse.paraview.org/u/eb1064)
#### Post date: [July 8, 2021, 7:16pm UTC](https://discourse.paraview.org/t/converting-csv-files-to-3d-plots-stuck/7560/13 "2021-07-08T19:16:24Z")
No, that worked! Thank you very much
---
### Author:  [@\_selah](https://discourse.paraview.org/u/_selah)
#### Post date: [September 6, 2022, 5:40pm UTC](https://discourse.paraview.org/t/converting-csv-files-to-3d-plots-stuck/7560/14 "2022-09-06T17:40:04Z")
thank you very much @utkarsh.ayachit I had the same problem
Is there a way to import or process the grid but with the point in the centroid of the cube?
I would like something like this
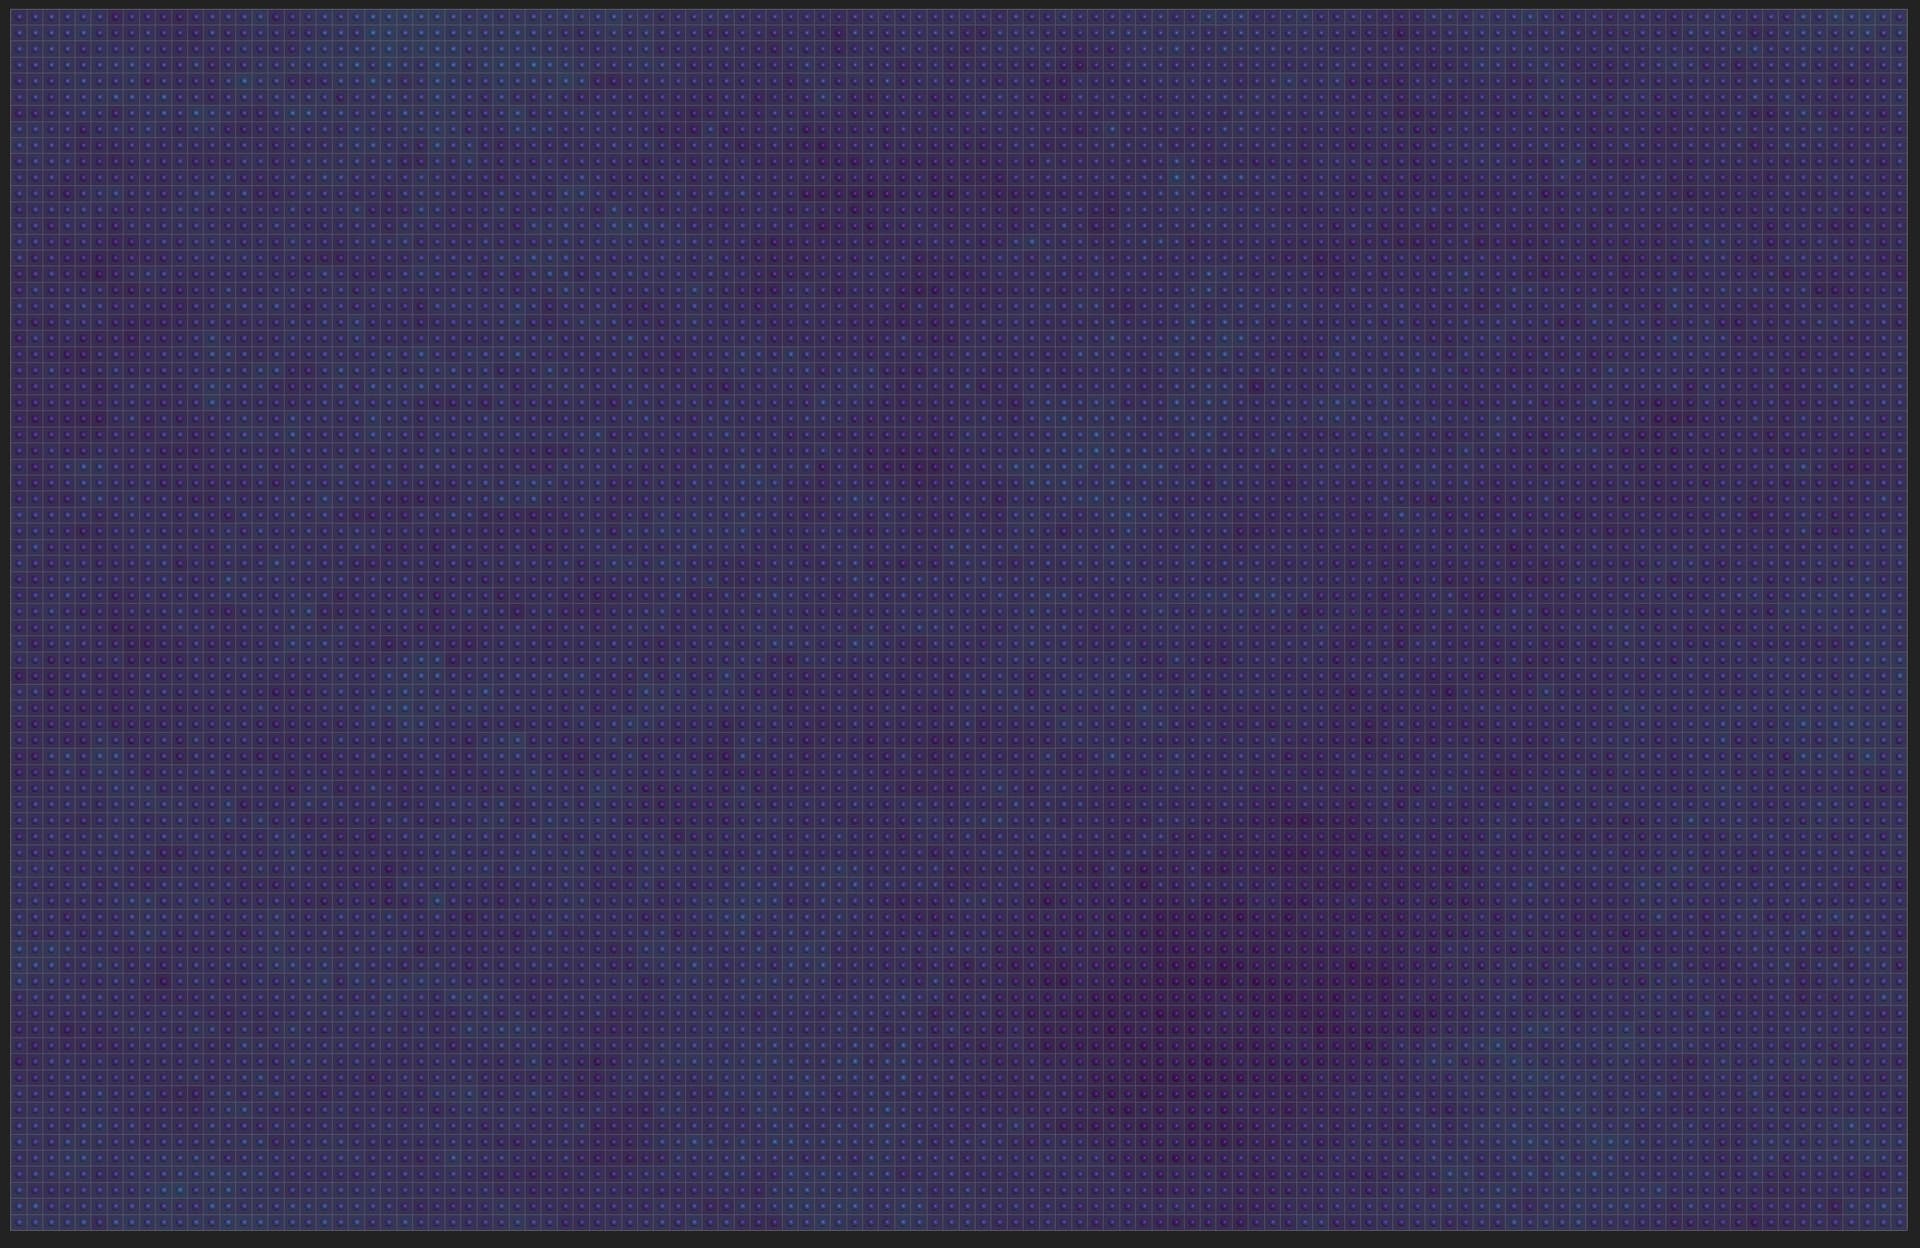
I have something like this

At the end I would like to assign a color to every cube based upon its value like this
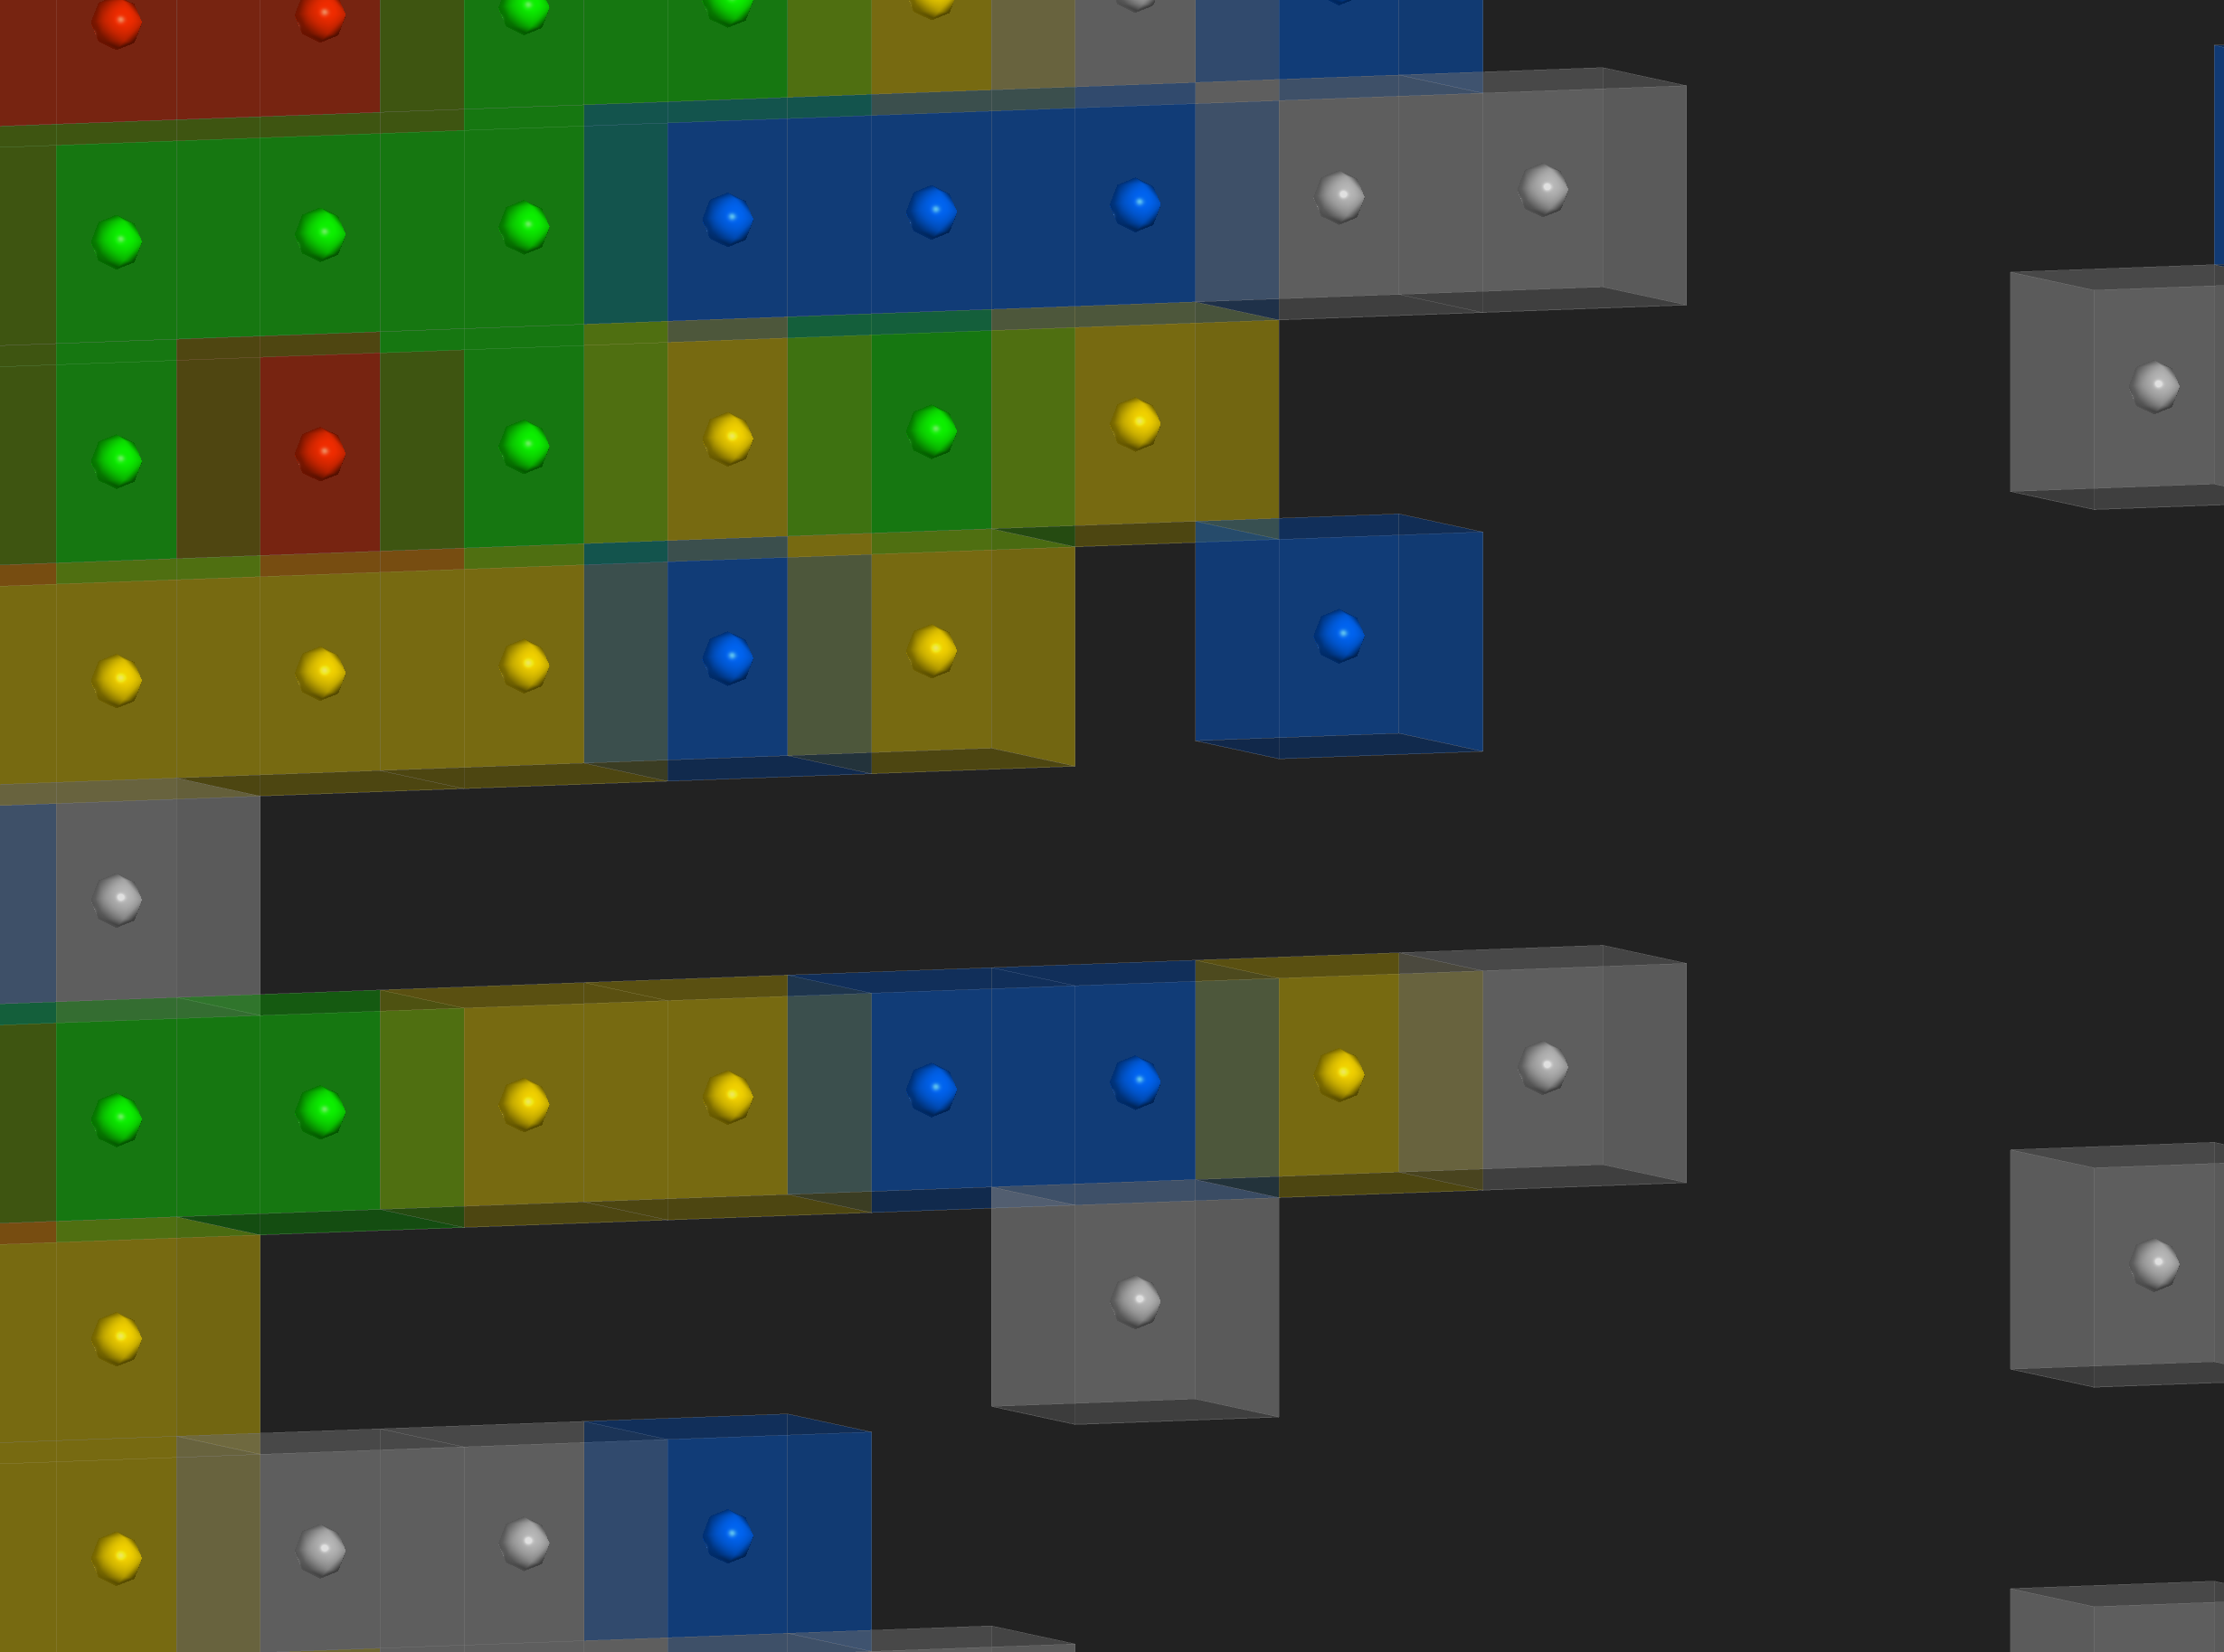
---
### Author:  [@cory.quammen](https://discourse.paraview.org/u/cory.quammen)
#### Post date: [September 6, 2022, 11:57pm UTC](https://discourse.paraview.org/t/converting-csv-files-to-3d-plots-stuck/7560/15 "2022-09-06T23:57:07Z")
You can use the **Cell Centers** filter to place points at the centers of the hexes, then add a **Glyph** filter with the **Glyph Type** set to “Sphere”.
---
### Author:  [@\_selah](https://discourse.paraview.org/u/_selah)
#### Post date: [September 7, 2022, 3:20pm UTC](https://discourse.paraview.org/t/converting-csv-files-to-3d-plots-stuck/7560/16 "2022-09-07T15:20:17Z")
Thank you @cory.quammen
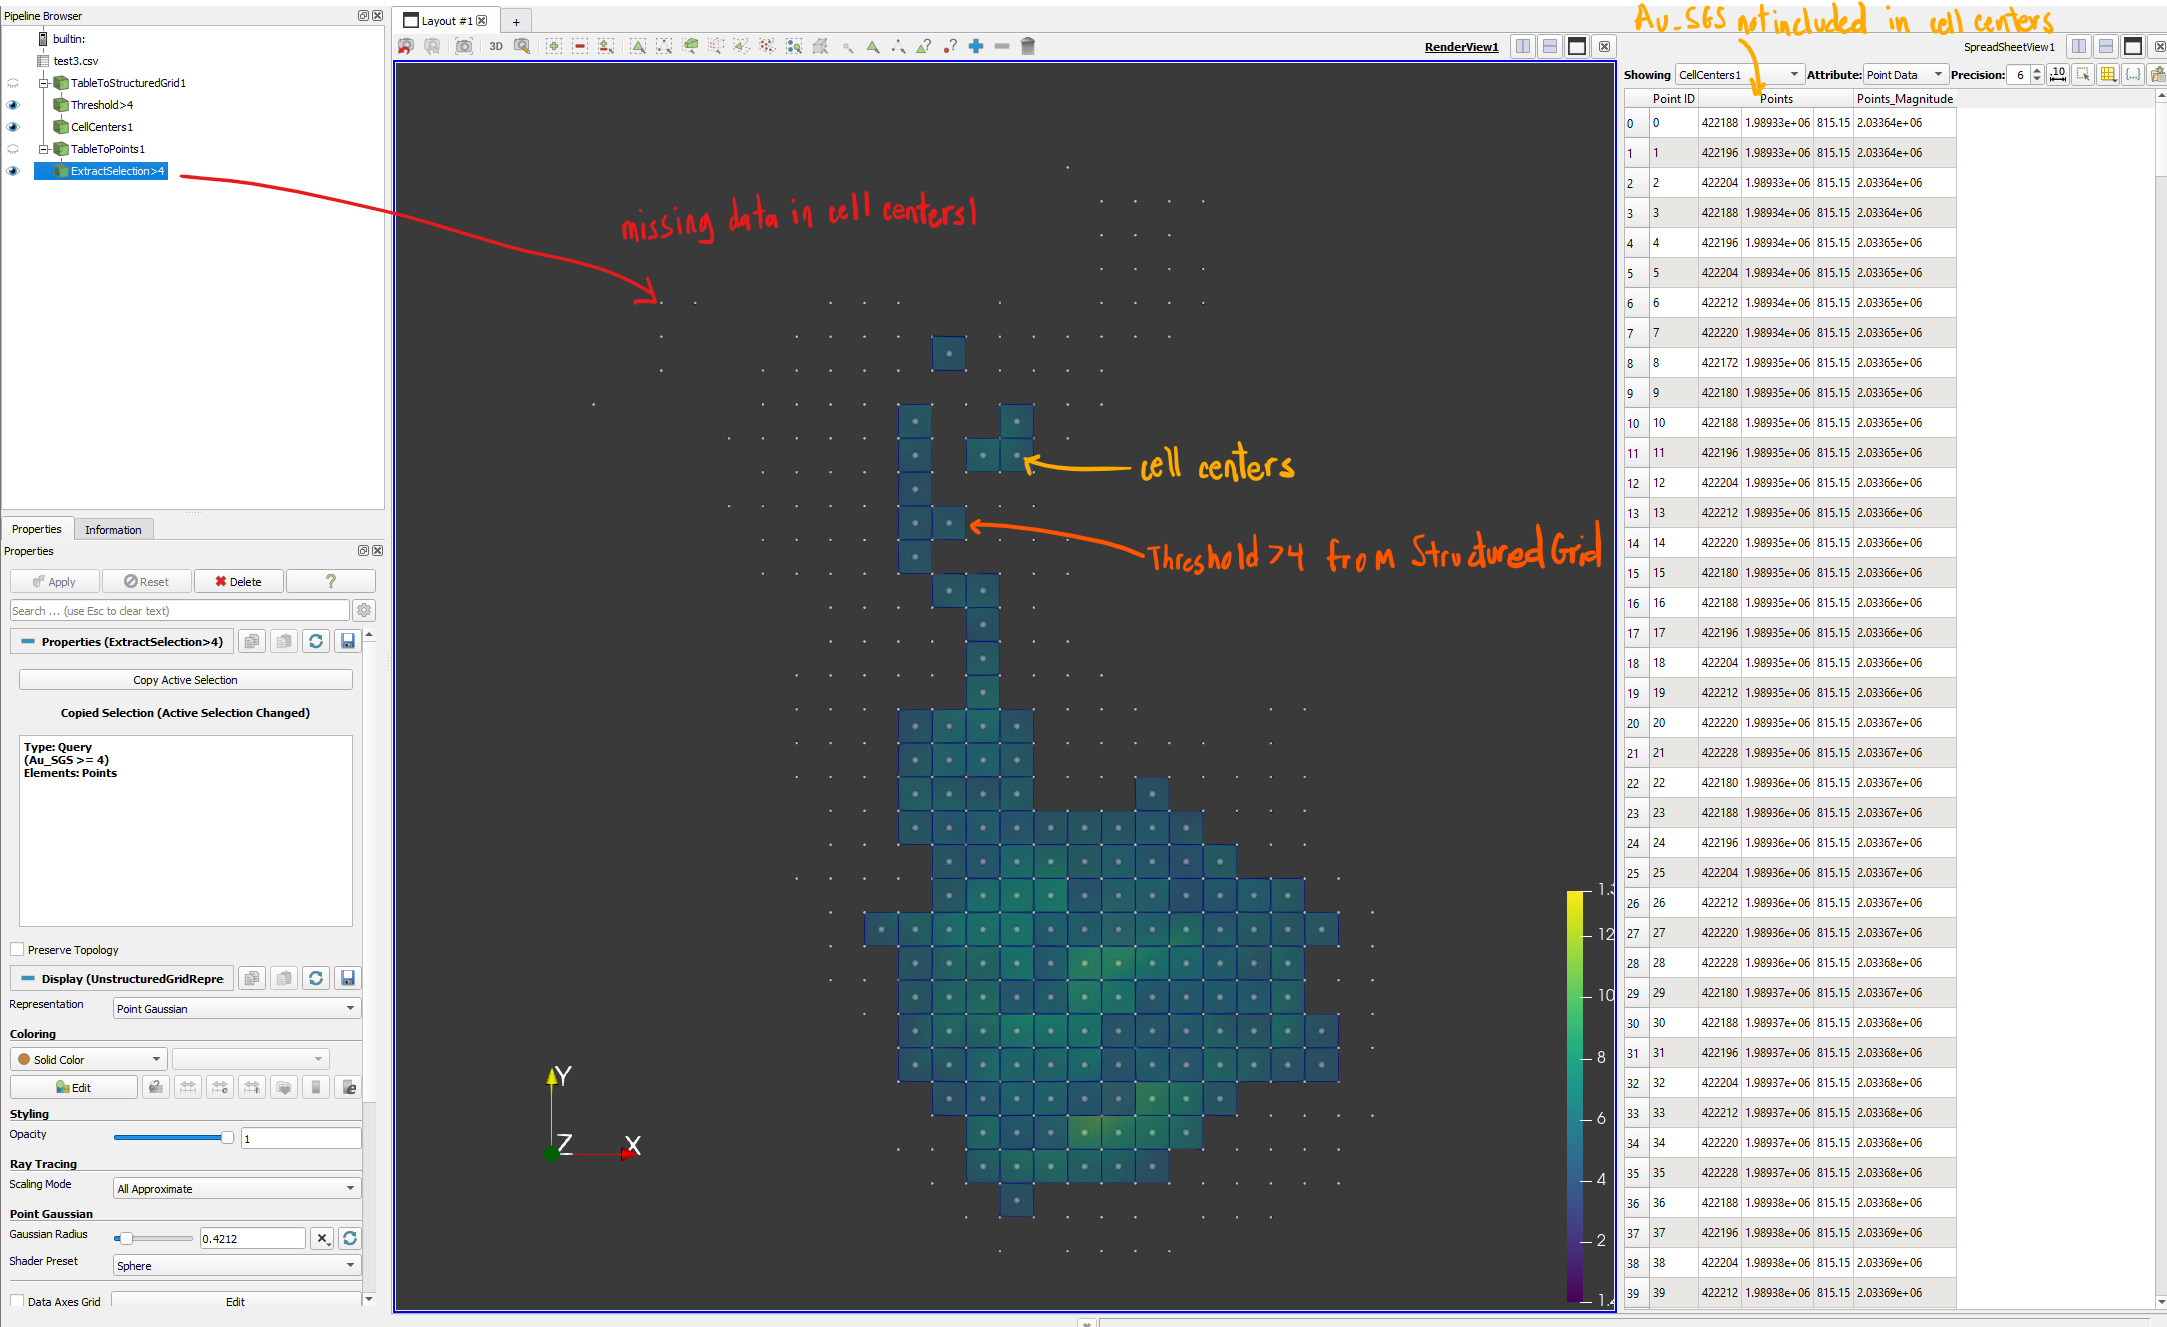
However, I would like to use the points like a centroid for every cube, because when I use the Threshold filter to the cells, in my example values \> 4 for Au\_SGS, and I repeat the same range for the points with a Extract Selection filter, the points and the cubes don’t match
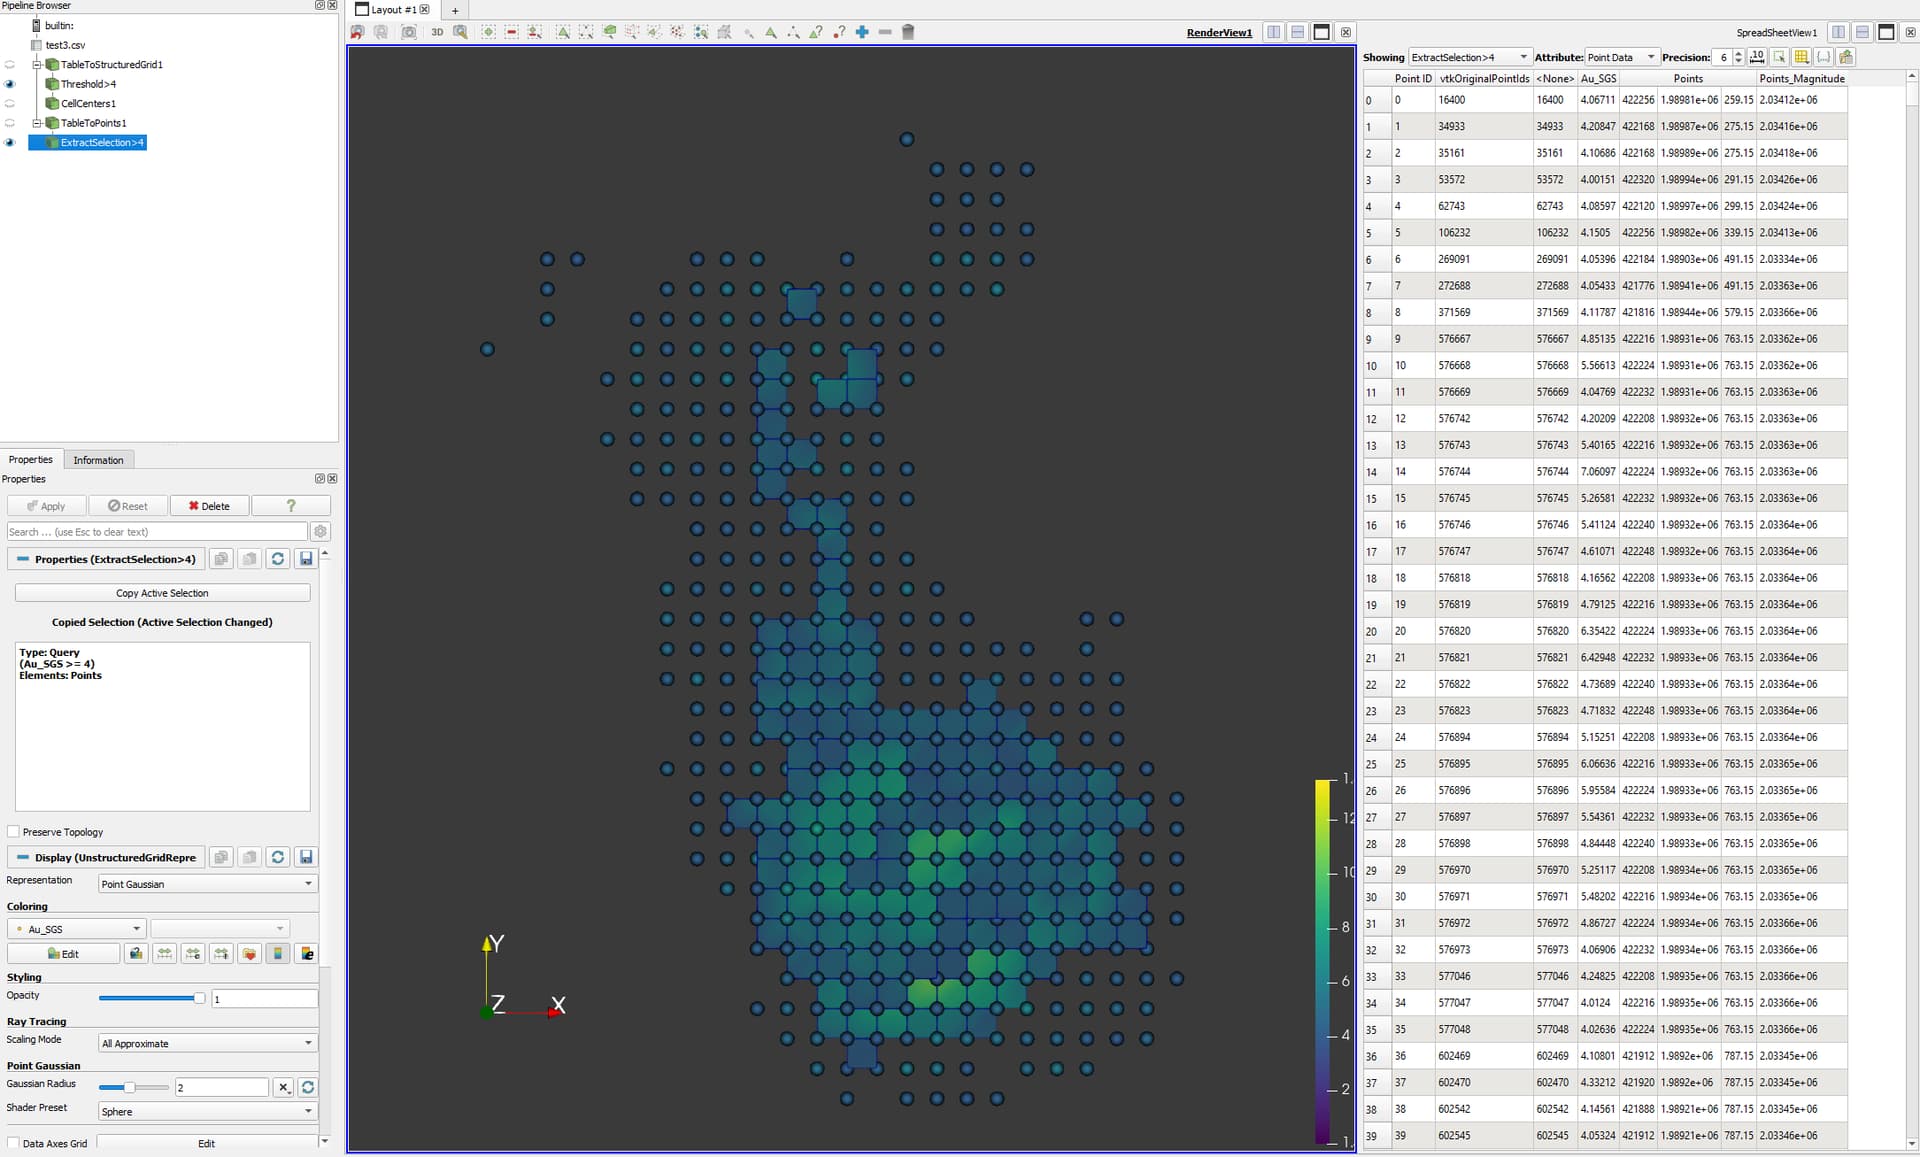
I would like to see this, where the points and cubes match and even I can assign a color for every point and cube based in its value
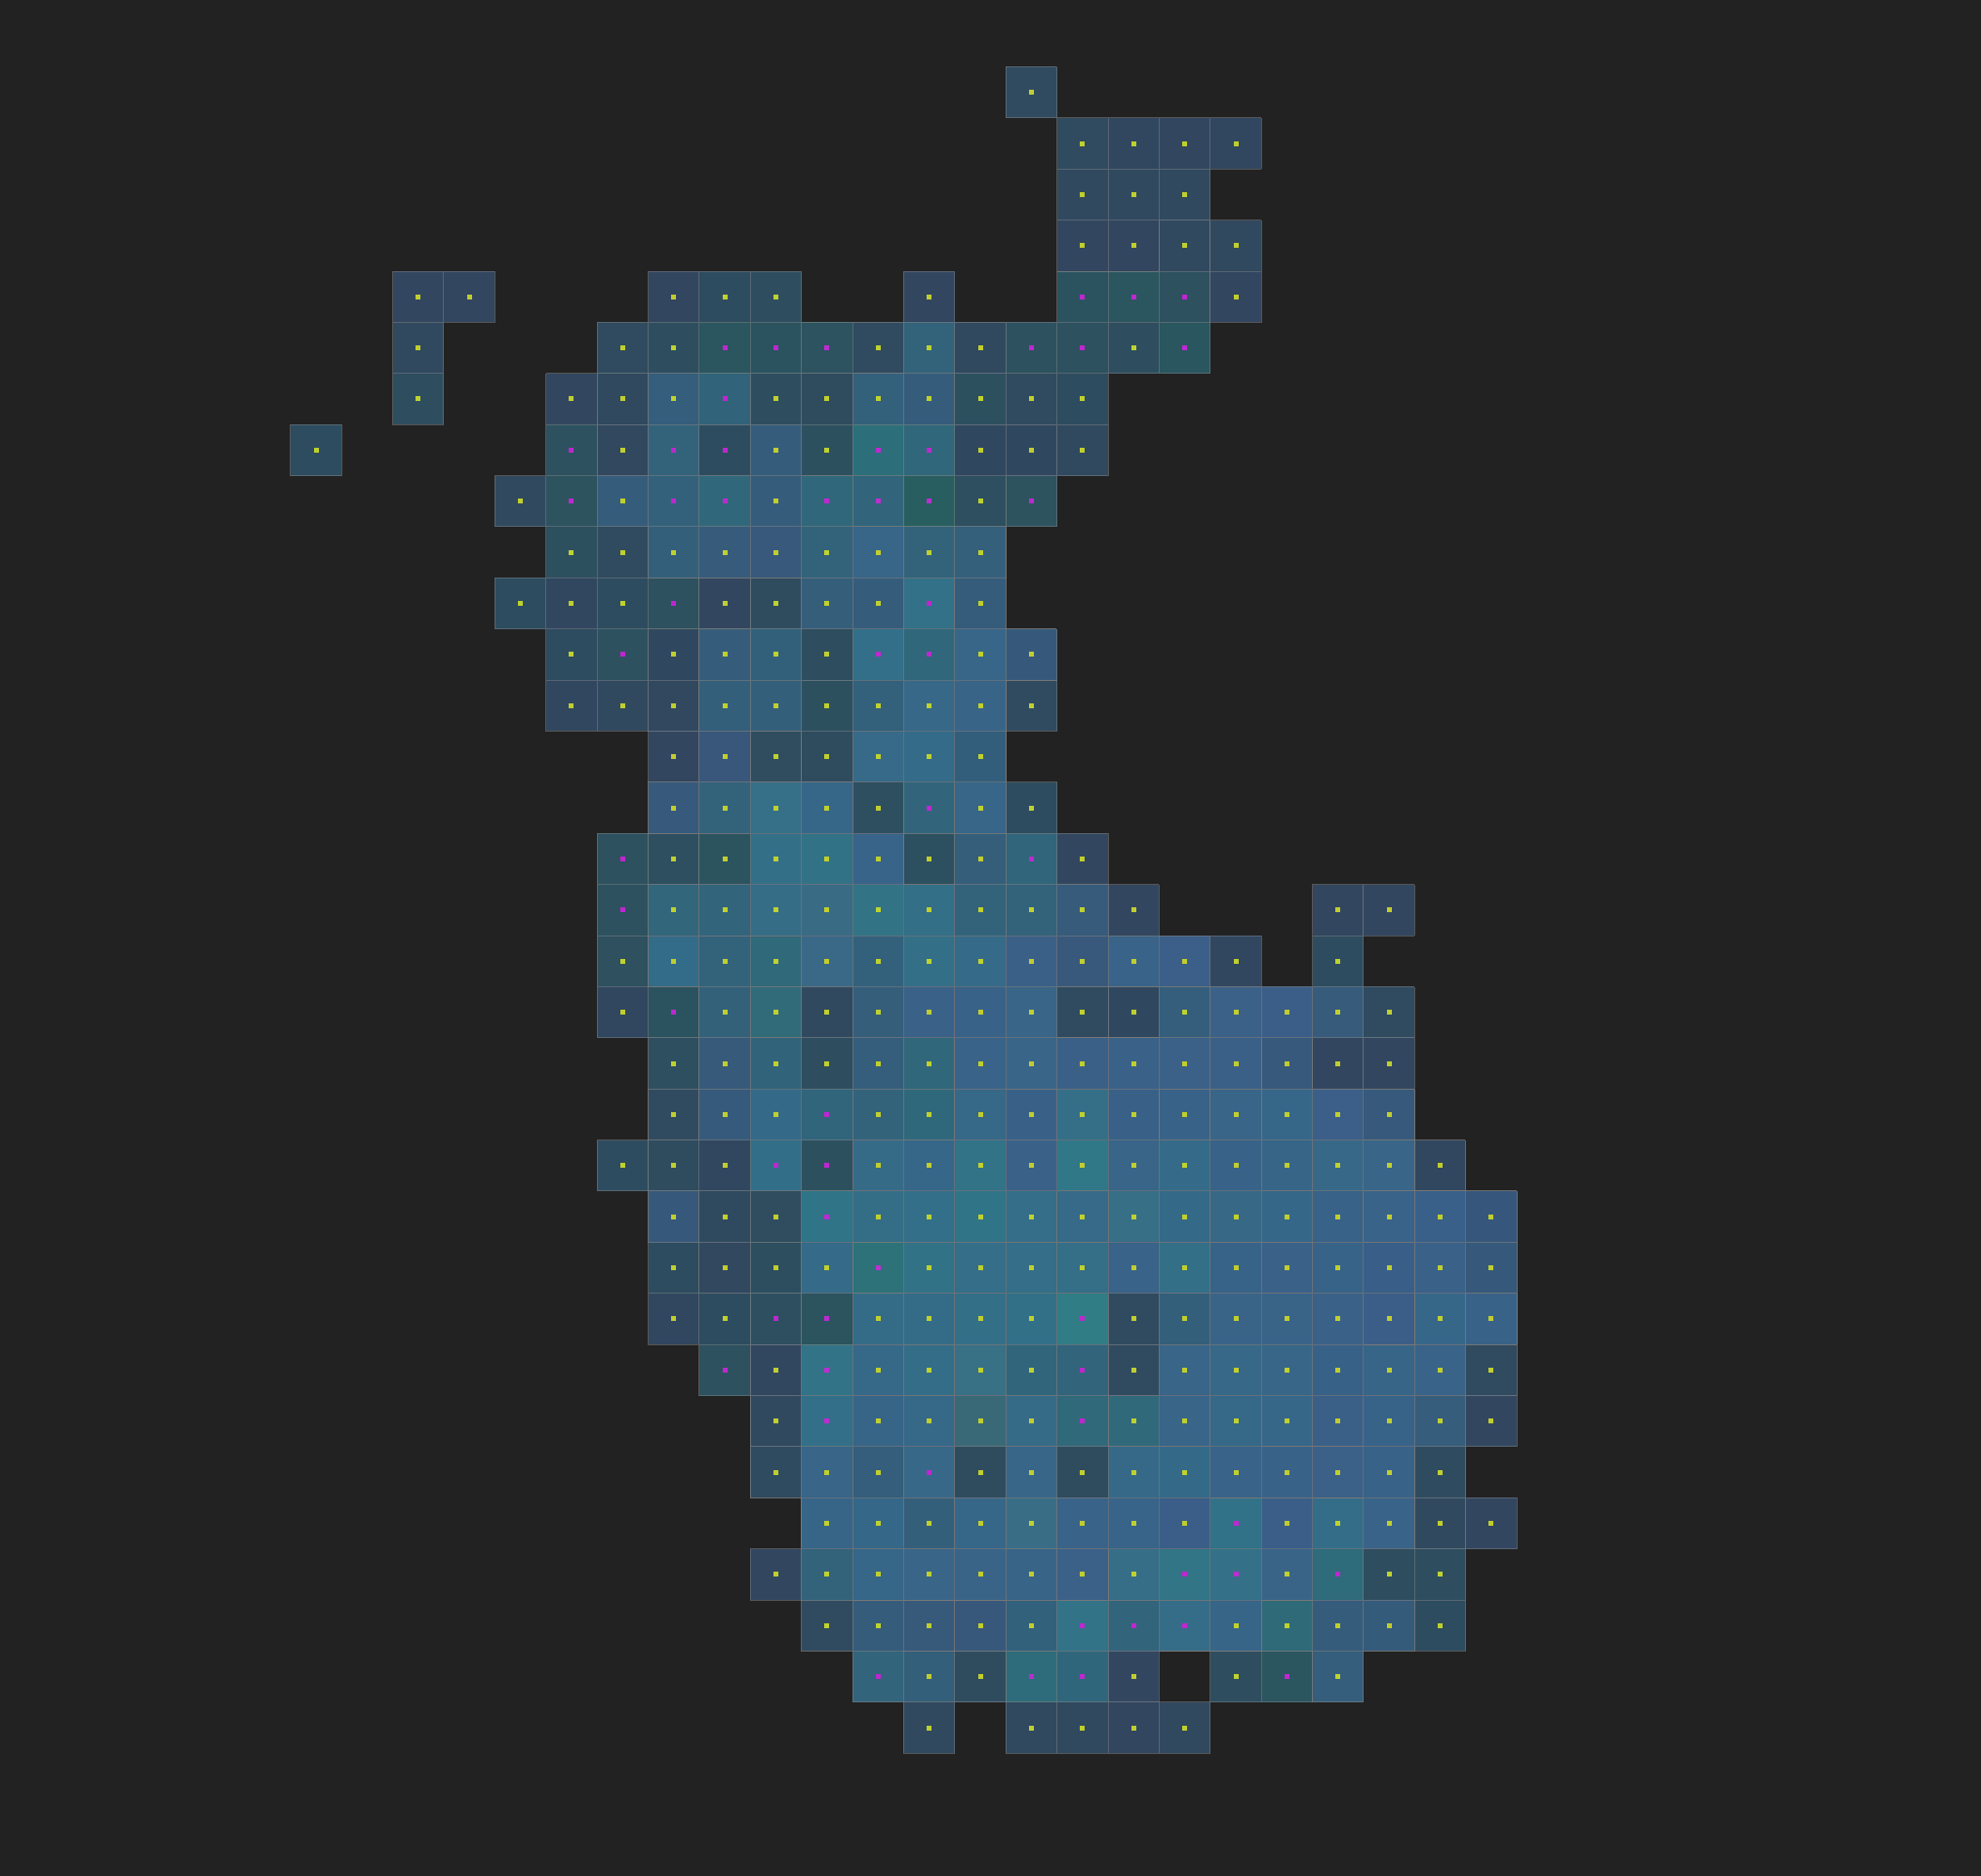
When I use the Cell Centers filter I get the centroid points but I lost the values of the points and it is not posible to assign a color map to every point, furthermore, due to I am getting the centroid points from the extracted cells (Au\_SGS \> 4) the centroids points are not what I expected, it is missing some cells and points
---
### Author:  [@cory.quammen](https://discourse.paraview.org/u/cory.quammen)
#### Post date: [September 8, 2022, 1:13pm UTC](https://discourse.paraview.org/t/converting-csv-files-to-3d-plots-stuck/7560/17 "2022-09-08T13:13:06Z")
It’s unfortunate **Cell Centers** doesn’t copy the cell data. That’s supported in the underlying VTK filter, just not made available in the ParaView exposure of that filter.
As a workaround in the version of ParaView you have, you can apply a **Resample With Dataset** filter. Set the “Source Data Arrays” input to your “Threshold\>4” filter, and the “Destination Mesh” to the “CellCenters1” filter. That will give resample the data arrays onto the cell centers.
---
### Author:  [@\_selah](https://discourse.paraview.org/u/_selah)
#### Post date: [September 8, 2022, 11:41pm UTC](https://discourse.paraview.org/t/converting-csv-files-to-3d-plots-stuck/7560/18 "2022-09-08T23:41:02Z")
Thanks @cory.quammen it looks bettter
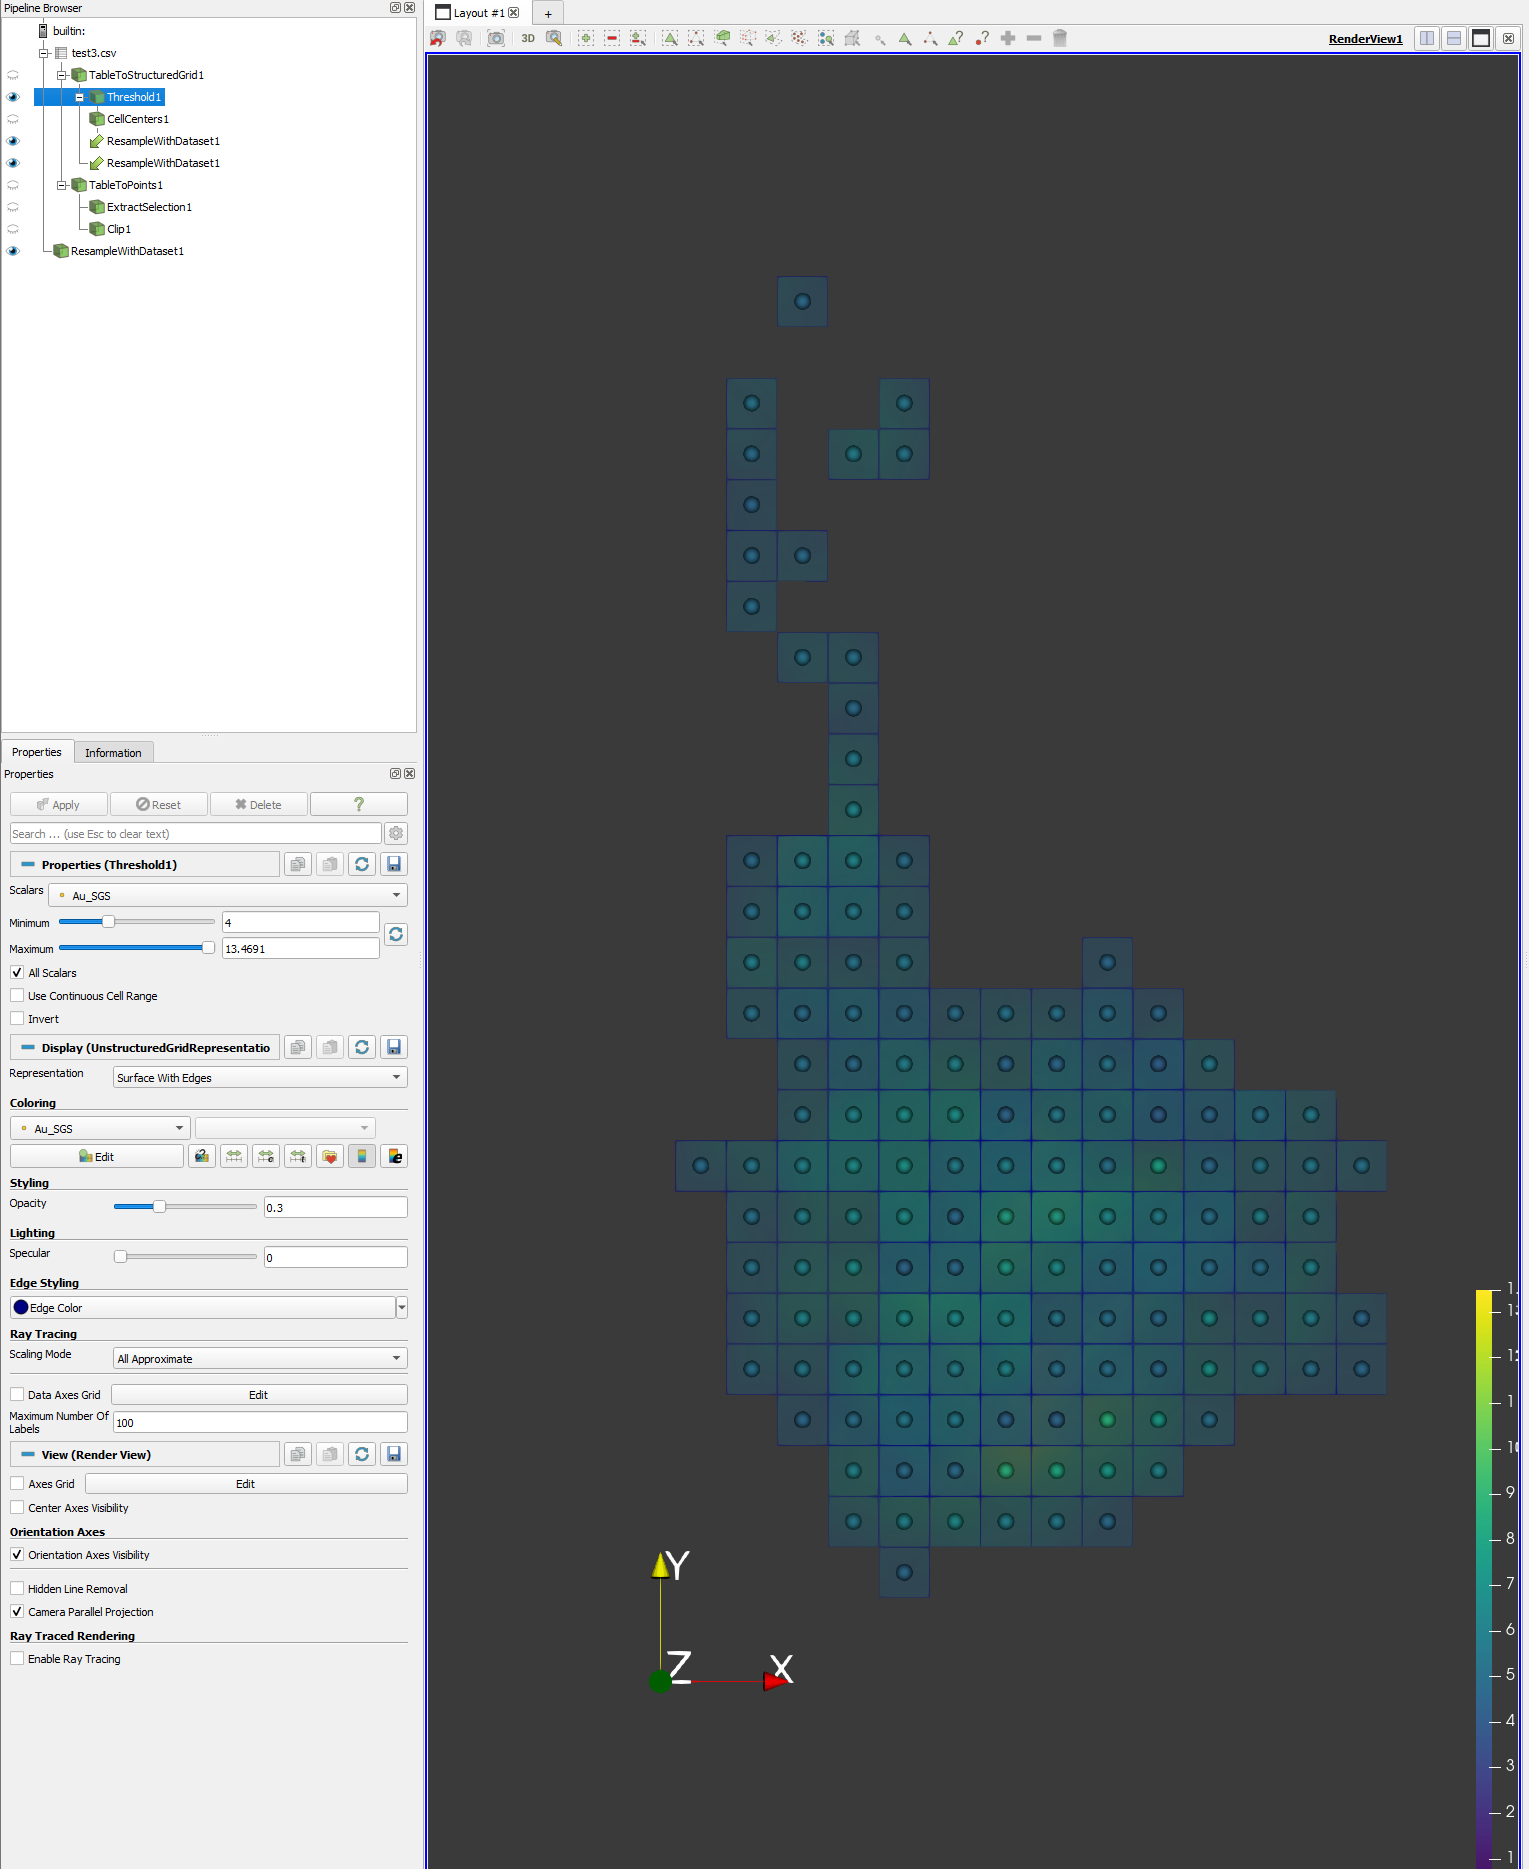
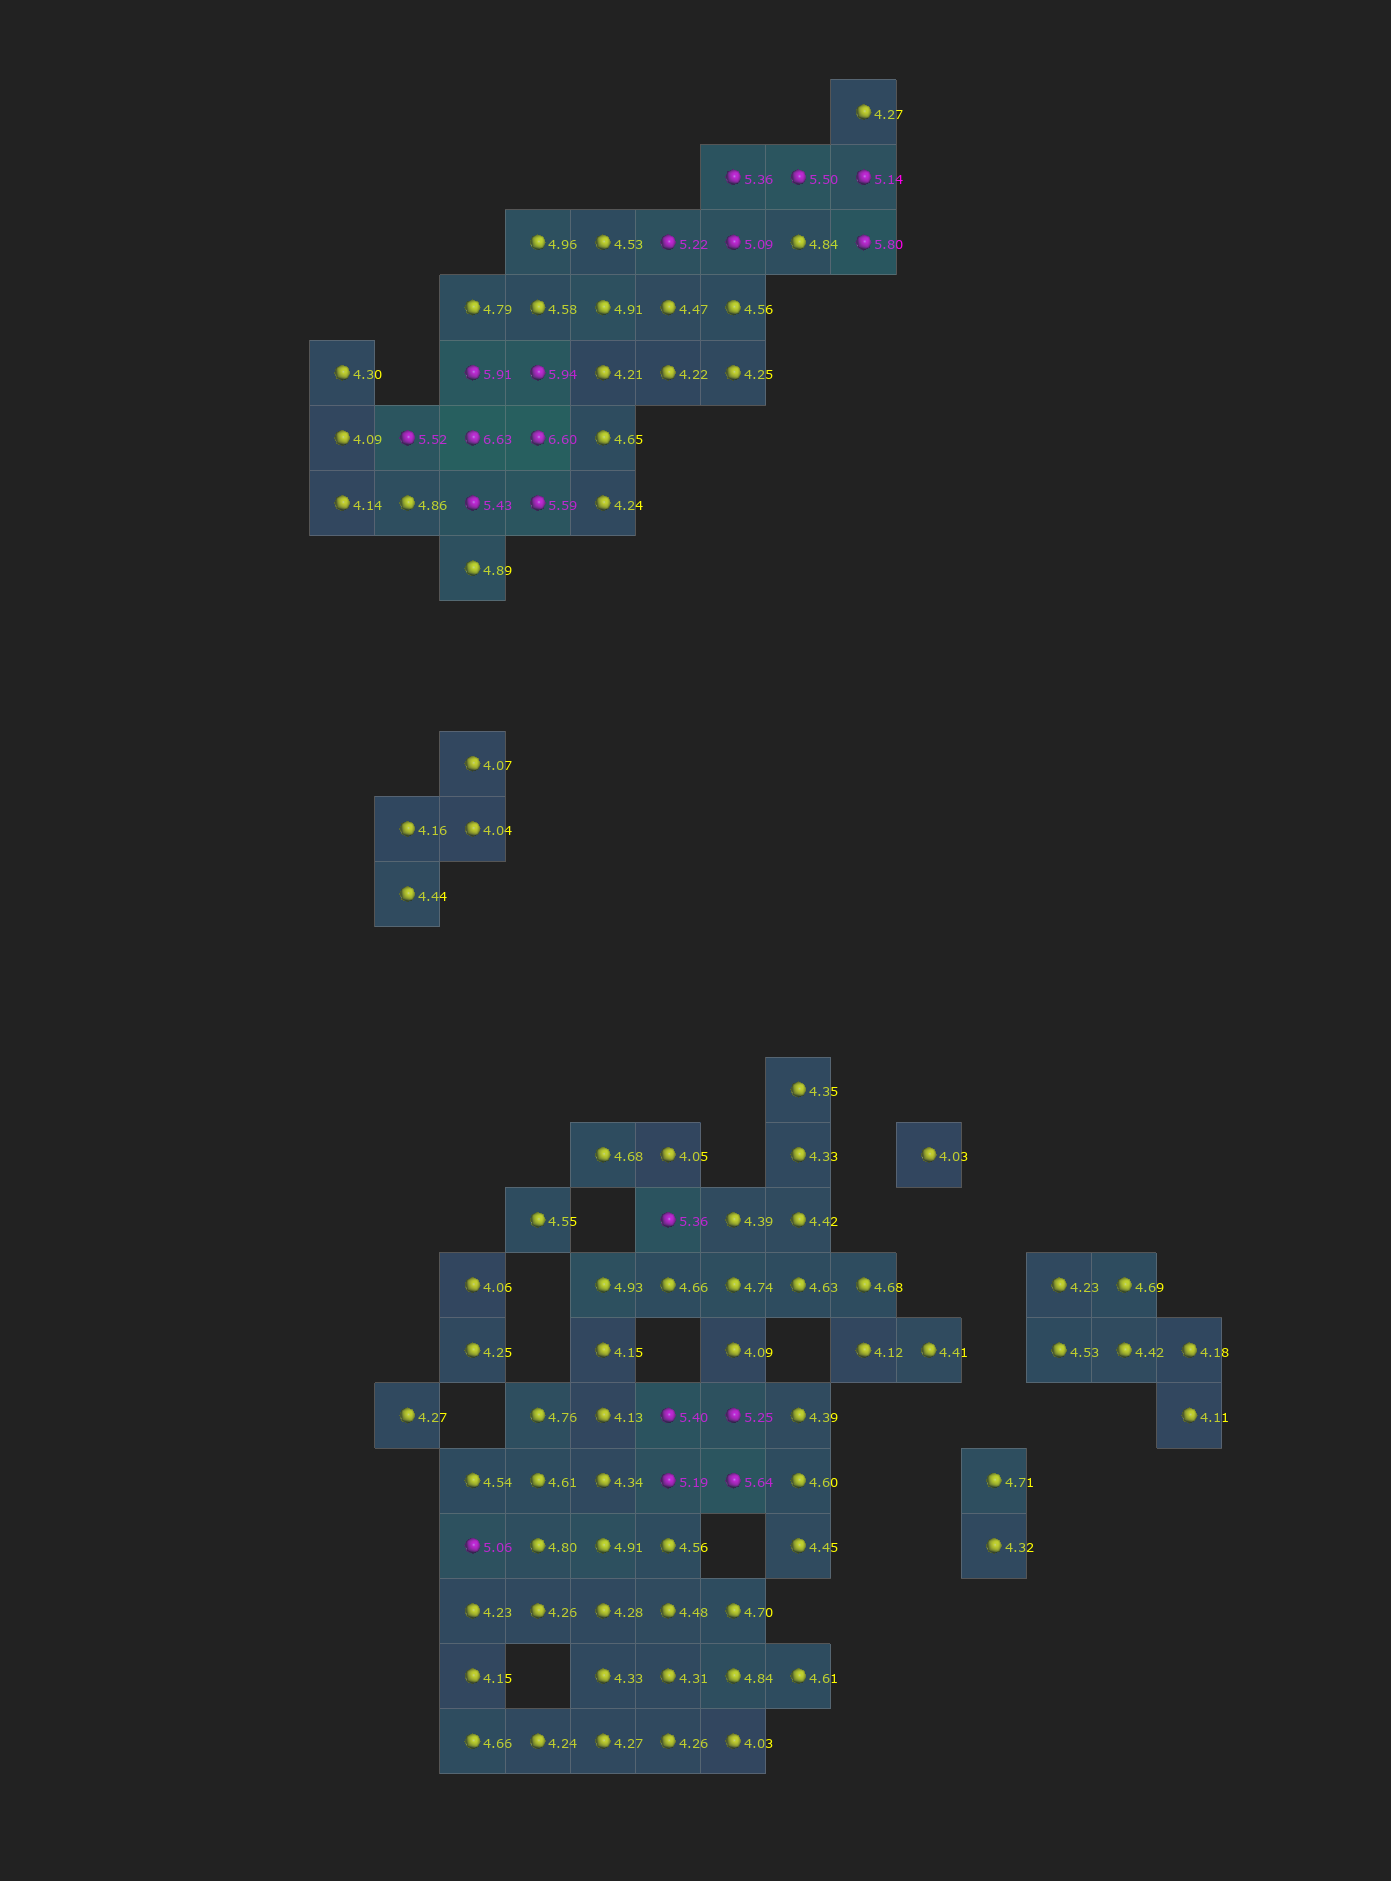
is it possible to add the labels for the points? like this:
---
### Author:  [@cory.quammen](https://discourse.paraview.org/u/cory.quammen)
#### Post date: [September 9, 2022, 12:52am UTC](https://discourse.paraview.org/t/converting-csv-files-to-3d-plots-stuck/7560/19 "2022-09-09T00:52:38Z")
You can add data labels for points that are selected, but this will affect the coloring of the data. To add labels, select from the Edit menu the Find Data item.
Under the Selection Display section in the Find Data panel, look for the popup menu labeled “Point Labels”. Pick the data array you want to use for labels. You should see the points labeled with their data values.
---
### Author:  [@Kenneth\_Moreland](https://discourse.paraview.org/u/Kenneth_Moreland)
#### Post date: [September 9, 2022, 12:35pm UTC](https://discourse.paraview.org/t/converting-csv-files-to-3d-plots-stuck/7560/20 "2022-09-09T12:35:39Z")
I note that this discussion had diverged quite a bit from the original question in multiple ways, but to circle back to using `Threshold` on the cell centroid, you can now use the `Append Location Attributes` filter on the original data. This will add a `CellCenters` field that you can run `Threshold` and other filters on.
Of course, `Append Location Attributes` will not let you _see_ the centroids, so you will still need to use `Cell Centers` to see the dot in the middle.
[Next page](https://discourse.paraview.org/t/converting-csv-files-to-3d-plots-stuck/7560.md?page=2)