# Create 3d topography from NetCDF
**URL:** https://discourse.paraview.org/t/create-3d-topography-from-netcdf/6261
**Category:** ParaView Support
**Created:** [January 21, 2021, 8:21am UTC](https://discourse.paraview.org/t/create-3d-topography-from-netcdf/6261 "2021-01-21T08:21:37Z")
**Posts on this page:** 18
**Page:** 1
### Author:  [@thomasvanderlinden](https://discourse.paraview.org/u/thomasvanderlinden)
#### Post date: [January 21, 2021, 8:21am UTC](https://discourse.paraview.org/t/create-3d-topography-from-netcdf/6261/1 "2021-01-21T08:21:38Z")
I would like to make a globe with topgraphy from a NetCDF. From these pages I get the impression that should be possible:
> **[Extrusion of topography and bathymetry — User Portal](https://www.dkrz.de/up/services/analysis/visualization/sw/paraview/tutorial/topography-extrusion)**
[https://earthmodels.org/date-and-tools/topography/exaggerated-topography-in-paraview](https://earthmodels.org/date-and-tools/topography/exaggerated-topography-in-paraview)
Problem I run into is that my calculator either provides the xyz-coordinates (on selecting point data) or the elevation (on selecting cell data). Never the two datatypes together, unlike the examples. I have converted the file to vtk (in Paraview), tried another reader (in an old version of Paraview).
Making a 3d topography does work with a vtp file of ETOPO provided by earthmodels, but that is not the data I need. I couldn’t find information on how to convert NetCDF to the right vtp format.
Hope you can help me!
---
### Author:  [@mwestphal](https://discourse.paraview.org/u/mwestphal)
#### Post date: [January 21, 2021, 9:36am UTC](https://discourse.paraview.org/t/create-3d-topography-from-netcdf/6261/2 "2021-01-21T09:36:12Z")
There is no reason for this not to work. Care to share your file ?
---
### Author:  [@thomasvanderlinden](https://discourse.paraview.org/u/thomasvanderlinden)
#### Post date: [January 21, 2021, 9:57am UTC](https://discourse.paraview.org/t/create-3d-topography-from-netcdf/6261/3 "2021-01-21T09:57:05Z")
> [@mwestphal](#):
>
> There is no reason for this not to work. Care to share your file ?
The files are too big (5.3 Mb or 25 Mb) to share or send in a private message. Can I email or upload another way?
---
### Author:  [@mwestphal](https://discourse.paraview.org/u/mwestphal)
#### Post date: [January 21, 2021, 10:31am UTC](https://discourse.paraview.org/t/create-3d-topography-from-netcdf/6261/4 "2021-01-21T10:31:13Z")
> **[WeTransfer](https://wetransfer.com/)**
>
> WeTransfer is the simplest way to send your files around the world
---
### Author:  [@thomasvanderlinden](https://discourse.paraview.org/u/thomasvanderlinden)
#### Post date: [January 21, 2021, 10:45am UTC](https://discourse.paraview.org/t/create-3d-topography-from-netcdf/6261/5 "2021-01-21T10:45:29Z")
Merci beaucoup Mathieu!
> **[SURFfilesender](https://filesender.surf.nl/?s=download&token=526a9d31-f67b-4c26-bb4d-c56eeea351e8)**
---
### Author:  [@thomasvanderlinden](https://discourse.paraview.org/u/thomasvanderlinden)
#### Post date: [January 22, 2021, 11:02am UTC](https://discourse.paraview.org/t/create-3d-topography-from-netcdf/6261/6 "2021-01-22T11:02:16Z")
@mwestphal My employer offers its own way of sending files. Does this work for you too?
---
### Author:  [@mwestphal](https://discourse.paraview.org/u/mwestphal)
#### Post date: [January 22, 2021, 11:04am UTC](https://discourse.paraview.org/t/create-3d-topography-from-netcdf/6261/7 "2021-01-22T11:04:37Z")
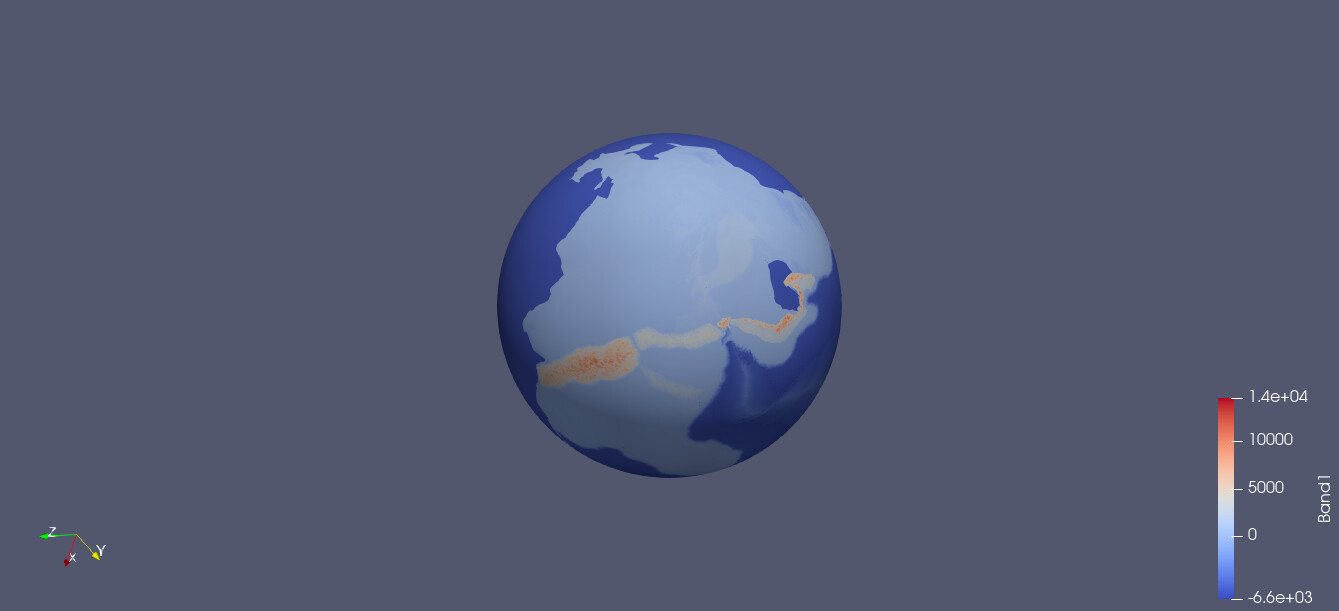
Yes, I’m able to open the file without issue:
---
### Author:  [@mwestphal](https://discourse.paraview.org/u/mwestphal)
#### Post date: [January 22, 2021, 11:07am UTC](https://discourse.paraview.org/t/create-3d-topography-from-netcdf/6261/8 "2021-01-22T11:07:30Z")
You don’t even need a calculator for what you want:
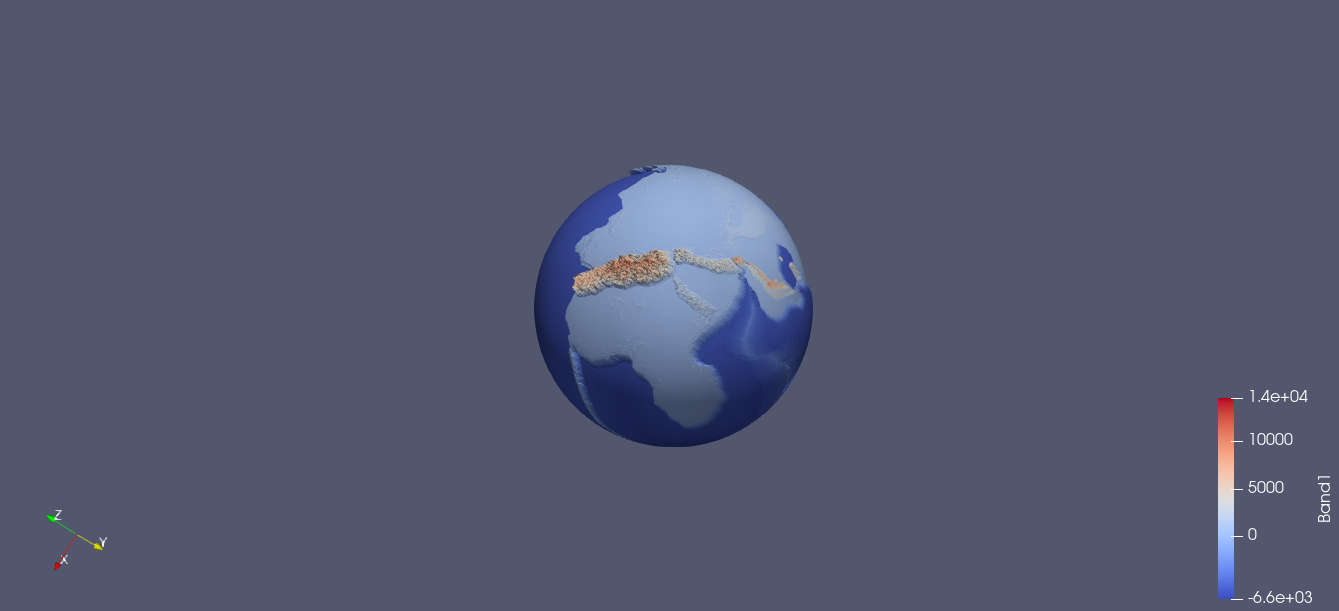
[a.pvsm](https://discourse.paraview.org/uploads/short-url/id0AMRyGGp31P9YsuzyO1rY0g46.pvsm) (389.8 KB)
Also take a look at:
> **[A new Embossing Representations Plugin for ParaView - Kitware Blog](https://blog.kitware.com/a-new-embossing-representations-plugin-for-paraview/)**
>
> Context Besides being large, climate simulations are usually comprised of many different variables and quantities that often need to be visualized side by side. The ... Read More
---
### Author:  [@mwestphal](https://discourse.paraview.org/u/mwestphal)
#### Post date: [January 22, 2021, 11:15am UTC](https://discourse.paraview.org/t/create-3d-topography-from-netcdf/6261/10 "2021-01-22T11:15:35Z")
You should then be able to use the calculator they want you may want to extrude your dataset.
---
### Author:  [@thomasvanderlinden](https://discourse.paraview.org/u/thomasvanderlinden)
#### Post date: [January 22, 2021, 11:15am UTC](https://discourse.paraview.org/t/create-3d-topography-from-netcdf/6261/11 "2021-01-22T11:15:48Z")
Thanks @mwestphal! I will look into that.
---
### Author:  [@florian.ziemen](https://discourse.paraview.org/u/florian.ziemen)
#### Post date: [January 22, 2021, 1:30pm UTC](https://discourse.paraview.org/t/create-3d-topography-from-netcdf/6261/12 "2021-01-22T13:30:32Z")
There’s a filter “Cell Data to Point Data” that would allow you to convert between the data types. Placing that between your source file and the calculator would allow you to access all fields (or a selected subset) as point data.
The embossing representations featured by Mathieu might be the faster solution for your problem, though.
---
### Author:  [@thomasvanderlinden](https://discourse.paraview.org/u/thomasvanderlinden)
#### Post date: [January 22, 2021, 2:37pm UTC](https://discourse.paraview.org/t/create-3d-topography-from-netcdf/6261/13 "2021-01-22T14:37:17Z")
Thanks @mwestphal and @florian.ziemen I got the suggestions from both of you working! 🙂
---
### Author:  [@\_Marco](https://discourse.paraview.org/u/_Marco)
#### Post date: [January 24, 2021, 12:16pm UTC](https://discourse.paraview.org/t/create-3d-topography-from-netcdf/6261/14 "2021-01-24T12:16:16Z")
@thomasvanderlinden : hi - another possible way to go is downloading **global** high resolution topo/bathymetric data from gebco (15 arc-second):
> **[GEBCO - The General Bathymetric Chart of the Oceans](https://www.gebco.net/)**
>
> The General Bathymetric Chart of the Oceans (GEBCO) aims to provide the most authoritative, publicly available bathymetry data sets for the world’s oceans.
Data come in (very conveniently) lat/long and you have elevation in meters. The netcdf file you will download download, in its metadata description, contains all the info and details about measurements and references adopted when creating the dataset.
You can also use a specialized color-map to color land and ocean (asymeetric, diverging).
And also, you can download the high definition coastline to overlap to your topo/bathy data. I am sure you might find this link interesting:
> **[Tutorial resources — User Portal](https://www.dkrz.de/up/services/analysis/visualization/sw/paraview/tutorial/tutorial-resources-1)**
Good luck.
Marco
---
### Author:  [@Coti](https://discourse.paraview.org/u/Coti)
#### Post date: [October 10, 2022, 6:40am UTC](https://discourse.paraview.org/t/create-3d-topography-from-netcdf/6261/15 "2022-10-10T06:40:29Z")
@_Marco
Hi Marco, I’m trying to upload elevation into Paraview. I’ve downloaded the data from gebco and was able to open the netcdf file on Paraview but it appears as a 2D map. is there an easy way see the elevation? Somehow converting each cell to the elevation within Paraview?
I really appreciate your help as I’m super stuck.
Thanks, Coti
---
### Author:  [@\_Marco](https://discourse.paraview.org/u/_Marco)
#### Post date: [October 10, 2022, 7:21am UTC](https://discourse.paraview.org/t/create-3d-topography-from-netcdf/6261/16 "2022-10-10T07:21:26Z")
Hi Coti.
There is a very convenient filter called wrap as scalar. That takes the elevation contained in gebco netcdf and uses that as vertical coordinate.
I can’t remember if it works with both sperical and planar coordinates, you’ll have to try yourself. But I’m sure it works with planar.
You can control the z scaling factor to exaggerate the vertical extrusion. Play a bit around with it. Also, once happy with vertical scaling, apply the right colormap: I suggest diverging asymmetric blue/green/brown. I’m sure you’ll be impressed by the result.
If you want a quick preview, you can see it here. I have used that to overlap my model data to high res topography and posted it on kitware blog.
[https://www.kitware.com/scientific-visualization-of-weather-research-and-forecasting-model-output-in-paraview/](https://www.kitware.com/scientific-visualization-of-weather-research-and-forecasting-model-output-in-paraview/)
Let me know if you need more guidance or support. Bye bye
m.
---
### Author:  [@Coti](https://discourse.paraview.org/u/Coti)
#### Post date: [October 10, 2022, 11:06pm UTC](https://discourse.paraview.org/t/create-3d-topography-from-netcdf/6261/17 "2022-10-10T23:06:51Z")
It works great! Thank you so so much Marco, I really appreciate it!
---
### Author:  [@Coti](https://discourse.paraview.org/u/Coti)
#### Post date: [October 10, 2022, 11:33pm UTC](https://discourse.paraview.org/t/create-3d-topography-from-netcdf/6261/18 "2022-10-10T23:33:11Z")
Just a follow up question, in case you know, is there a way to smooth out the topography so it doesn’t look like point spikes? Thanks, Coti
---
### Author:  [@\_Marco](https://discourse.paraview.org/u/_Marco)
#### Post date: [October 14, 2022, 11:22am UTC](https://discourse.paraview.org/t/create-3d-topography-from-netcdf/6261/19 "2022-10-14T11:22:44Z")
Hi.
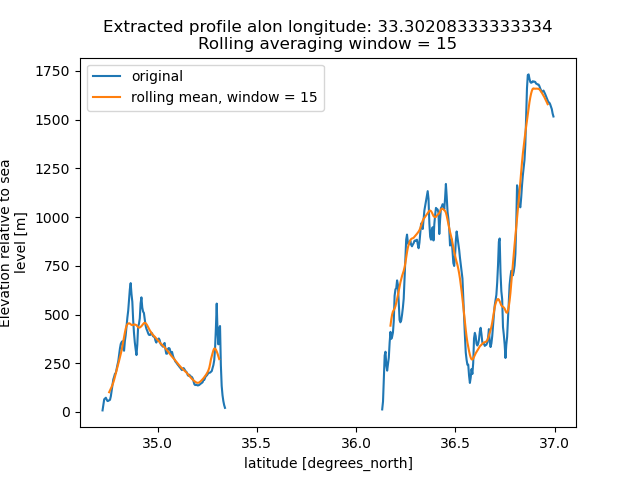
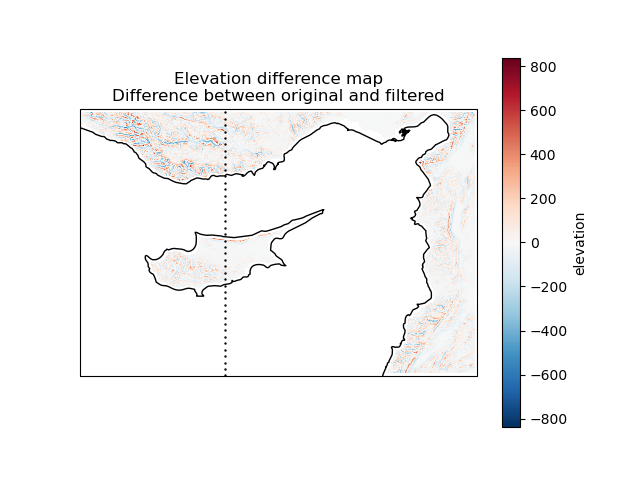
I do that in Python, using xarray. I am using rolling average filtering, along either dimension.
By modulating the window width, I can get the results I want and most like.