# Create a graph
**URL:** https://discourse.paraview.org/t/create-a-graph/6783
**Category:** ParaView Support
**Created:** [March 24, 2021, 10:24am UTC](https://discourse.paraview.org/t/create-a-graph/6783 "2021-03-24T10:24:10Z")
**Posts on this page:** 7
**Page:** 1
### Author:  [@Maria\_co](https://discourse.paraview.org/u/Maria_co)
#### Post date: [March 24, 2021, 10:24am UTC](https://discourse.paraview.org/t/create-a-graph/6783/1 "2021-03-24T10:24:10Z")
Hello everyone, I am trying to use paraview very recently in the field of scientific research. I have a doubt that I cannot resolve, maybe some of you will be able to help me.
I have a series of data (x, y, z) of which I would like to graph. I can load a .csv file, but I can’t get these points on the “point chart view” screen.
Can you help me?
---
### Author:  [@nicolas.vuaille](https://discourse.paraview.org/u/nicolas.vuaille)
#### Post date: [March 24, 2021, 12:31pm UTC](https://discourse.paraview.org/t/create-a-graph/6783/2 "2021-03-24T12:31:37Z")
What kind of visualisation are you expecting ?
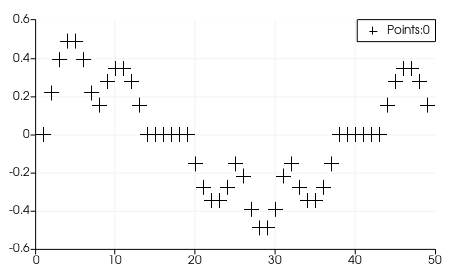
Point Chart View is only a 2D plot, as here:
To position points in 3D space you should use the RenderView:

But the csv reader produce a table that is not displayable in RenderView. Use the `TableToPoints` filter on you csv reader to create points (check the X/Y/Z columns names in the properties)
---
### Author:  [@Maria\_co](https://discourse.paraview.org/u/Maria_co)
#### Post date: [March 25, 2021, 8:58am UTC](https://discourse.paraview.org/t/create-a-graph/6783/3 "2021-03-25T08:58:52Z")
My idea is to create many points (or even better spheres) whose positions are given in the x, y, z file and then visualize them in virtual reality.
I’ll try with your suggestion.
thank you so much!!
---
### Author:  [@nicolas.vuaille](https://discourse.paraview.org/u/nicolas.vuaille)
#### Post date: [March 25, 2021, 10:13am UTC](https://discourse.paraview.org/t/create-a-graph/6783/4 "2021-03-25T10:13:42Z")
Ok.
So you need the TableToPoints solution. Then use the Point Gaussian representation in the RenderView to display spheres for each point instead of pixels
---
### Author:  [@Maria\_co](https://discourse.paraview.org/u/Maria_co)
#### Post date: [April 6, 2021, 10:44am UTC](https://discourse.paraview.org/t/create-a-graph/6783/5 "2021-04-06T10:44:39Z")
Thank you very much for your help!!
I would like to ask you another something else:
Following th example show in “CSV time series” on [paraview.org](http://paraview.org), I am in front of a screen of this type
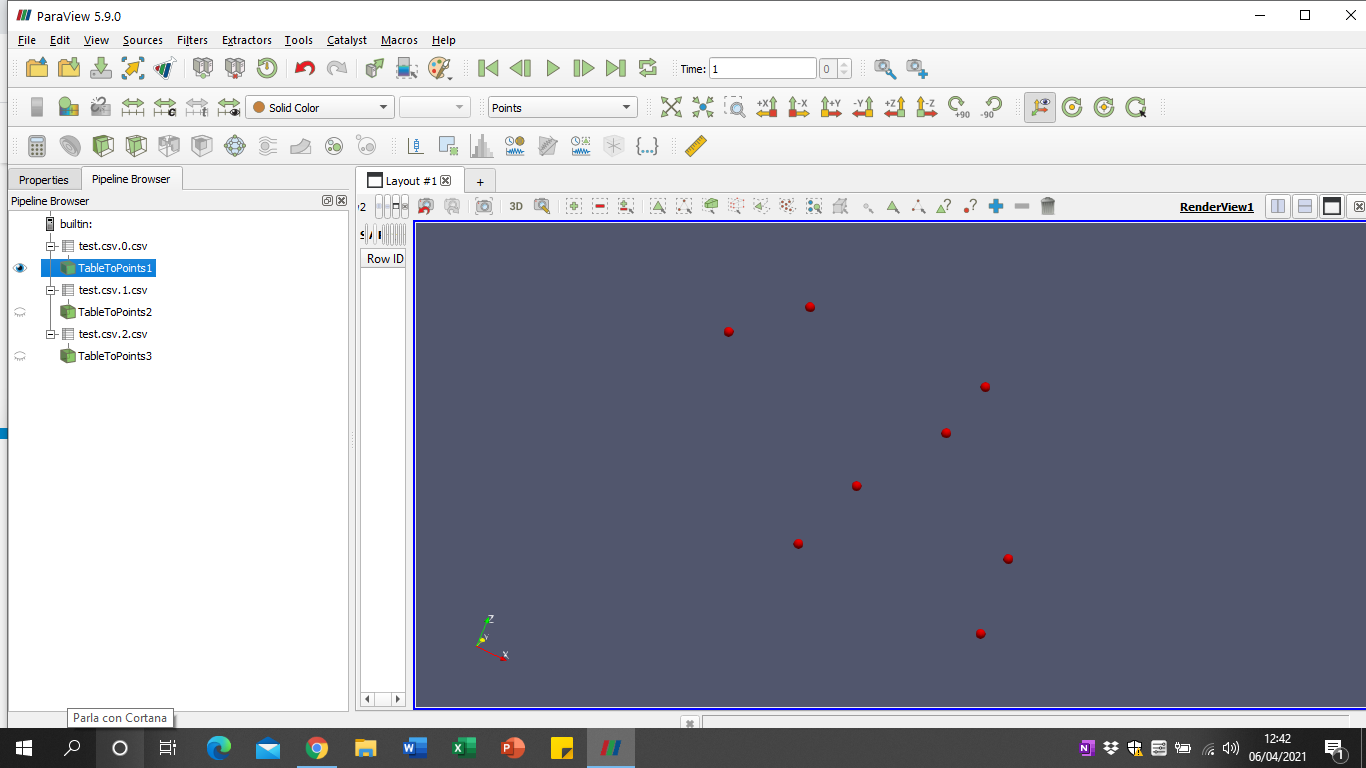
Do I need some other filter to create an animation that goes from the first to the third file? I don’t know if I’m doing something wrong
---
### Author:  [@nicolas.vuaille](https://discourse.paraview.org/u/nicolas.vuaille)
#### Post date: [April 6, 2021, 11:51am UTC](https://discourse.paraview.org/t/create-a-graph/6783/6 "2021-04-06T11:51:38Z")
You need to open your files as a [FileSeries](https://docs.paraview.org/en/latest/UsersGuide/dataIngestion.html?highlight=file%20serie#opening-data-files-in-paraview). In the open dialog, instead of selecting all files you should choose the entry with dots instead of number. In your case, it should be something `test.csv...csv`. Then you will have only item in the pipeline, corresponding to the first file. You can use the Play/Next buttons to go through timesteps: the pipeline will be executed with the new input dataset.
You can then [export the animation](https://docs.paraview.org/en/latest/UsersGuide/savingResults.html#saving-animation)
---
### Author:  [@Maria\_co](https://discourse.paraview.org/u/Maria_co)
#### Post date: [April 7, 2021, 7:52am UTC](https://discourse.paraview.org/t/create-a-graph/6783/7 "2021-04-07T07:52:38Z")
Ok, thank you very much!! I did it 🙂