# Create and visualize streamline of velocity field
**URL:** https://discourse.paraview.org/t/create-and-visualize-streamline-of-velocity-field/1436
**Category:** ParaView Support
**Created:** [March 10, 2019, 5:04pm UTC](https://discourse.paraview.org/t/create-and-visualize-streamline-of-velocity-field/1436 "2019-03-10T17:04:16Z")
**Posts on this page:** 5
**Page:** 1
### Author:  [@drudox00](https://discourse.paraview.org/u/drudox00)
#### Post date: [March 10, 2019, 5:04pm UTC](https://discourse.paraview.org/t/create-and-visualize-streamline-of-velocity-field/1436/1 "2019-03-10T17:04:16Z")
Hi everybody !
I have the follow object :
- a 3d cube velocity magnitude and velocity vector field (\*.vtr format)
- a 3d polydata (\*.vtk) set of point (representing polymer smaller than one cell of the previous cube)
I would like to create the stream line of velocity around the polymer , which is the correct procedure to compute it ??
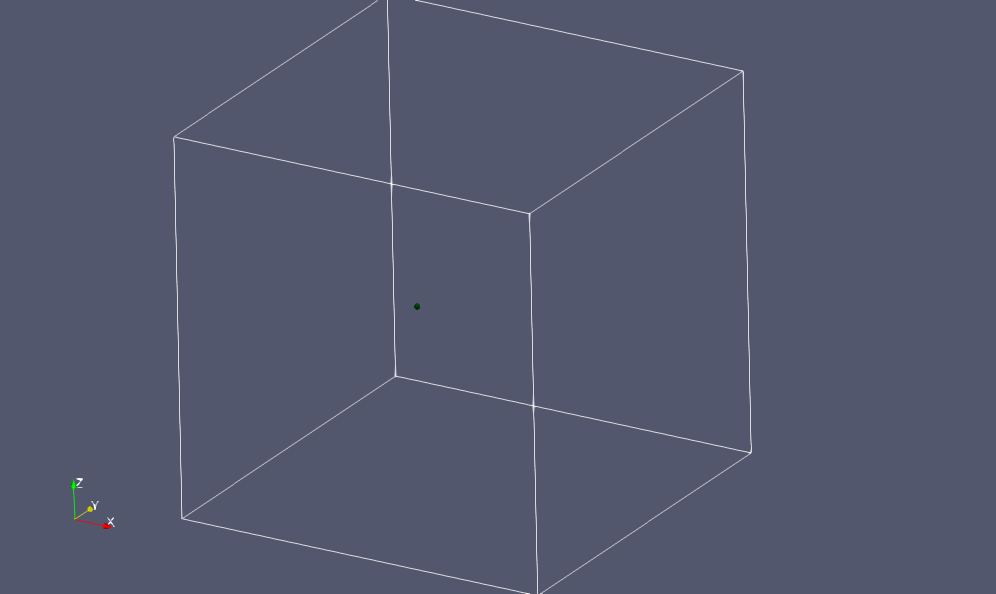
this is my situations : (I used a very large sphere to represent the polydata (respect to the polymer))!
---
### Author:  [@drudox00](https://discourse.paraview.org/u/drudox00)
#### Post date: [March 10, 2019, 5:08pm UTC](https://discourse.paraview.org/t/create-and-visualize-streamline-of-velocity-field/1436/2 "2019-03-10T17:08:33Z")
I would have a small subset in which I see the streamline of velocity field surrounding polymer
---
### Author:  [@mwestphal](https://discourse.paraview.org/u/mwestphal)
#### Post date: [March 11, 2019, 9:36am UTC](https://discourse.paraview.org/t/create-and-visualize-streamline-of-velocity-field/1436/3 "2019-03-11T09:36:50Z")
Did you try the stream tracer ?
---
### Author:  [@drudox00](https://discourse.paraview.org/u/drudox00)
#### Post date: [March 11, 2019, 9:54am UTC](https://discourse.paraview.org/t/create-and-visualize-streamline-of-velocity-field/1436/4 "2019-03-11T09:54:56Z")
Yes I tried ! but if I select the vtr imported object the stream tracer is not available as filter !
this is th reason why I’m asking for the correct procedure … if for example I create a probe locator from the main object then the stream tracer is clickable (available) but I would like to use the filter “stream tracer from custom area” in order to create stream tracer from the centre of poly\_data representing the polymer ! May you help me about ?
---
### Author:  [@mwestphal](https://discourse.paraview.org/u/mwestphal)
#### Post date: [March 11, 2019, 9:58am UTC](https://discourse.paraview.org/t/create-and-visualize-streamline-of-velocity-field/1436/5 "2019-03-11T09:58:25Z")
The following should work:
- Open Both of your files
- Click on the 3d velocity cube
- Add a “Stream Tracer with Custom Source” Filter
- In the input dialog, select your polydata as the “Source”
- Configure the Stream Tracer according to your needs, Apply