# create cylinders from csv file with start and end locations
**URL:** https://discourse.paraview.org/t/create-cylinders-from-csv-file-with-start-and-end-locations/11425
**Category:** ParaView Support
**Created:** [February 16, 2023, 2:42pm UTC](https://discourse.paraview.org/t/create-cylinders-from-csv-file-with-start-and-end-locations/11425 "2023-02-16T14:42:13Z")
**Posts on this page:** 8
**Page:** 1
### Author:  [@Trailer1](https://discourse.paraview.org/u/Trailer1)
#### Post date: [February 16, 2023, 2:42pm UTC](https://discourse.paraview.org/t/create-cylinders-from-csv-file-with-start-and-end-locations/11425/1 "2023-02-16T14:42:13Z")
Hello to all,
I have a .csv file with (x,y,z) positions of start and end positions of cylinders.
I would like to import this into paraview and create the cylinders givent the (x,y,z) of start points, and (x,y,z) of end points and specify the radius.
Is this possible?
I will leave an example .csv file:
[foo.csv](https://discourse.paraview.org/uploads/short-url/xdB3lYwAwxXDdgpa1T3bv0gSw3J.csv) (1.2 KB)
Best regards
---
### Author:  [@nicolas.vuaille](https://discourse.paraview.org/u/nicolas.vuaille)
#### Post date: [February 17, 2023, 8:38am UTC](https://discourse.paraview.org/t/create-cylinders-from-csv-file-with-start-and-end-locations/11425/2 "2023-02-17T08:38:03Z")
The easiest way is to use a [programmable source](https://docs.paraview.org/en/latest/ReferenceManual/pythonProgrammableFilter.html#reading-a-csv-file-with-particles) and to write the reading part in python.
Note that the `Tube` filter creates a cylinder from lines, so you may just create a simple polydata and apply this filter.
---
### Author:  [@Kenichiro-Yoshimi](https://discourse.paraview.org/u/Kenichiro-Yoshimi)
#### Post date: [February 17, 2023, 10:17am UTC](https://discourse.paraview.org/t/create-cylinders-from-csv-file-with-start-and-end-locations/11425/3 "2023-02-17T10:17:34Z")
In `Programmable Source`, I tried to use `Cylinder Source` and it became very complicated. nicolas.vuaille is right, it is much better to use **Tube filter**.
Just for reference, here is a dirty `script` for `Programmable Source`.
```python
import numpy as np
import vtk
# CSV file to define the cylinders
csv_file = 'C:/Users/icem/Desktop/cyl/foo.csv'
# cylinder radius
r = 0.025
# CSV file reading
data = np.genfromtxt(csv_file, skip_header=2, dtype=None, names=['start_x','start_y','start_z','end_x','end_y','end_z'], delimiter=',', autostrip=True)
# obtain starting and ending coordinates of cylinders
start_pnts = np.vstack([data['start_x'],data['start_y'],data['start_z']]).T
end_pnts = np.vstack([data['end_x'],data['end_y'],data['end_z']]).T
appender = vtk.vtkAppendPolyData()
for start_pnt, end_pnt in zip(start_pnts, end_pnts):
# center coordinates of a cylinder
center = (start_pnt + end_pnt)*0.5
# direction vector of a cylinder
direc = end_pnt - start_pnt
# height of cylinder
h = np.linalg.norm(direc)
# define the local coordinate system of a cylinder
dir2 = direc / h
dir1 = np.array([dir2[1], -dir2[0], 0])
dir1 /= np.linalg.norm(dir1)
dir3 = np.cross(dir1, dir2)
# basis transformation matrix of the local coordinate system of a cylinder
T = np.array([dir1, dir2, dir3]).T
T = np.concatenate([T, np.zeros((3,1))], axis=1)
T = np.concatenate([T, np.zeros((1,4))], axis=0)
T[3, 3] = 1.0
# create a cylinder
cyl = vtk.vtkCylinderSource()
cyl.SetCenter([0,0,0])
cyl.SetRadius(r)
cyl.SetHeight(h)
cyl.SetResolution(100)
cyl.Update()
# transforms cylinder along its local coordinate system
transform = vtk.vtkTransform()
transform.PostMultiply()
transform.SetMatrix(T.flatten())
transform.Translate(center)
transformFilter = vtk.vtkTransformPolyDataFilter()
transformFilter.SetInputData(cyl.GetOutput())
transformFilter.SetTransform(transform)
transformFilter.Update()
# add a cylinder to appender
appender.AddInputData(transformFilter.GetOutput())
appender.Update()
output.DeepCopy(appender.GetOutput())
```
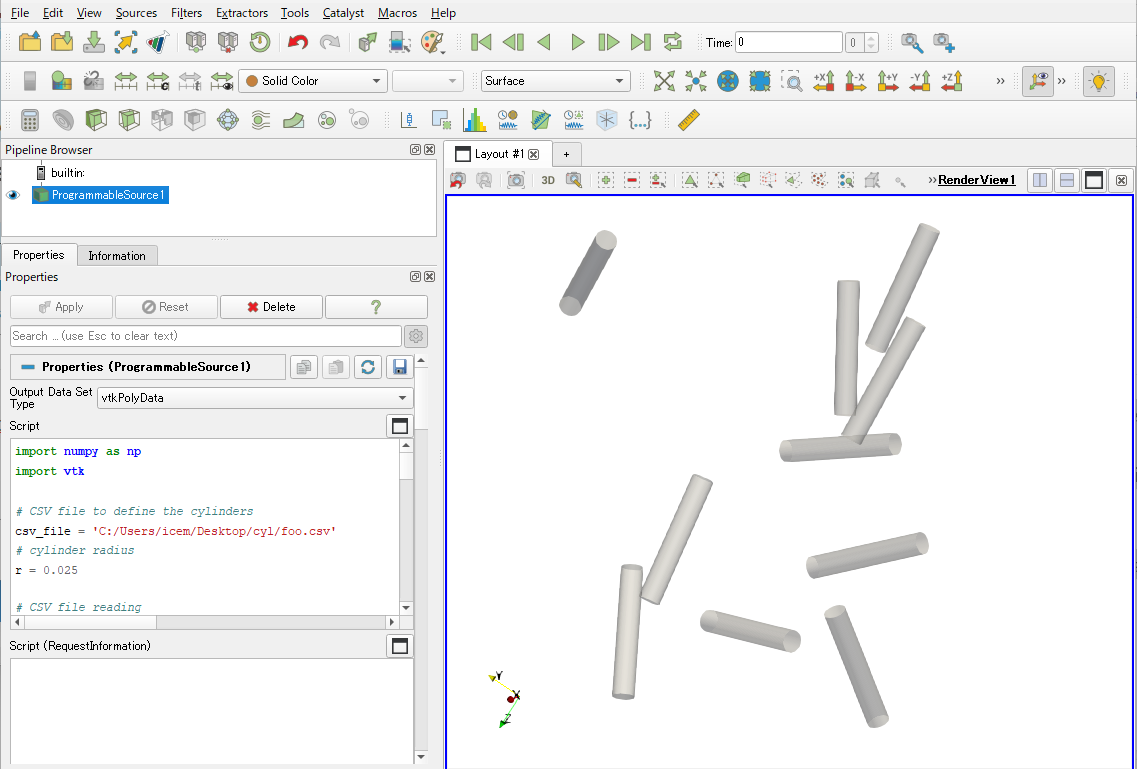
---
### Author:  [@Trailer1](https://discourse.paraview.org/u/Trailer1)
#### Post date: [February 17, 2023, 7:53pm UTC](https://discourse.paraview.org/t/create-cylinders-from-csv-file-with-start-and-end-locations/11425/4 "2023-02-17T19:53:58Z")
> [@nicolas.vuaille](#):
>
> an
How can I create the polydata?
---
### Author:  [@Kenichiro-Yoshimi](https://discourse.paraview.org/u/Kenichiro-Yoshimi)
#### Post date: [February 17, 2023, 11:43pm UTC](https://discourse.paraview.org/t/create-cylinders-from-csv-file-with-start-and-end-locations/11425/5 "2023-02-17T23:43:36Z")
When using the `Tube` filter, the `Programmable Source` `script` becomes very simple as follows.
```python
import numpy as np
import vtk
# CSV file to define the cylinders
csv_file = 'C:/Users/icem/Desktop/cyl/foo.csv'
# cylinder radius
r = 0.025
# CSV file reading
data = np.genfromtxt(csv_file, skip_header=2, dtype=None, names=['start_x','start_y','start_z','end_x','end_y','end_z'], delimiter=',', autostrip=True)
# obtain starting and ending coordinates of cylinders
start_pnts = np.vstack([data['start_x'],data['start_y'],data['start_z']]).T
end_pnts = np.vstack([data['end_x'],data['end_y'],data['end_z']]).T
appender = vtk.vtkAppendPolyData()
for start_pnt, end_pnt in zip(start_pnts, end_pnts):
# creating the central axis of a cylinder
line = vtk.vtkLineSource()
line.SetPoint1(start_pnt)
line.SetPoint2(end_pnt)
line.SetResolution(1)
line.Update()
# creating a cylinder
tubefilter = vtk.vtkTubeFilter()
tubefilter.SetInputData(line.GetOutput())
tubefilter.SetRadius(r)
tubefilter.SetNumberOfSides(50)
tubefilter.CappingOn()
tubefilter.Update()
# add a cylinder to appender
appender.AddInputData(tubefilter.GetOutput())
appender.Update()
output.DeepCopy(appender.GetOutput())
```
---
### Author:  [@Trailer1](https://discourse.paraview.org/u/Trailer1)
#### Post date: [February 19, 2023, 7:43pm UTC](https://discourse.paraview.org/t/create-cylinders-from-csv-file-with-start-and-end-locations/11425/6 "2023-02-19T19:43:47Z")
This worked!
I am trying to figure out out to ask information to the user (file name, and name of an image to save). I used trace feature to get a python script
---
### Author:  [@JER1](https://discourse.paraview.org/u/JER1)
#### Post date: [July 24, 2023, 2:11am UTC](https://discourse.paraview.org/t/create-cylinders-from-csv-file-with-start-and-end-locations/11425/8 "2023-07-24T02:11:43Z")
Really appreciate your help.
It can be very helpful to me.
Actually, I have a question about this problem.
In my case, I need to add various tube radii and colors.
But the error showed only scalar-type data is available.
Could you help me to solve this problem?
---
### Author:  [@Kenichiro-Yoshimi](https://discourse.paraview.org/u/Kenichiro-Yoshimi)
#### Post date: [July 24, 2023, 9:54am UTC](https://discourse.paraview.org/t/create-cylinders-from-csv-file-with-start-and-end-locations/11425/9 "2023-07-24T09:54:08Z")
Hi,
I don’t have a good grasp of what you want to do, but if you want to add new arrays, the following is a good reference.
[https://docs.paraview.org/en/latest/ReferenceManual/pythonProgrammableFilter.html#reading-a-csv-file-with-particles](https://docs.paraview.org/en/latest/ReferenceManual/pythonProgrammableFilter.html#reading-a-csv-file-with-particles)
If the radius of each cylinder changes, you may want to add an array of radii to the `zip` function. Also, if you need to color by RGB, the following is a good guide.
> [@how to use RGB vectors as rgb coloring in Paraview](https://discourse.paraview.org/t/how-to-use-rgb-vectors-as-rgb-coloring-in-paraview/7470):
>
> Dear community members. I hope that I can find my answer here. I created a “VTK” output which gives an RGB vector for each point on my microstructure. The RGB range is (0-255), not (0-1); however, I can normalize the vector as well. My question is, How do we get the RGB colour in Paraview out of these vectors? Kindly find my output. Is it possible? Could you please advise me Best regards, Hesham Salama