# Create line plot
**URL:** https://discourse.paraview.org/t/create-line-plot/12561
**Category:** ParaView Support
**Created:** [July 22, 2023, 4:43am UTC](https://discourse.paraview.org/t/create-line-plot/12561 "2023-07-22T04:43:04Z")
**Posts on this page:** 5
**Page:** 1
### Author:  [@Chhotelal](https://discourse.paraview.org/u/Chhotelal)
#### Post date: [July 22, 2023, 4:43am UTC](https://discourse.paraview.org/t/create-line-plot/12561/1 "2023-07-22T04:43:04Z")
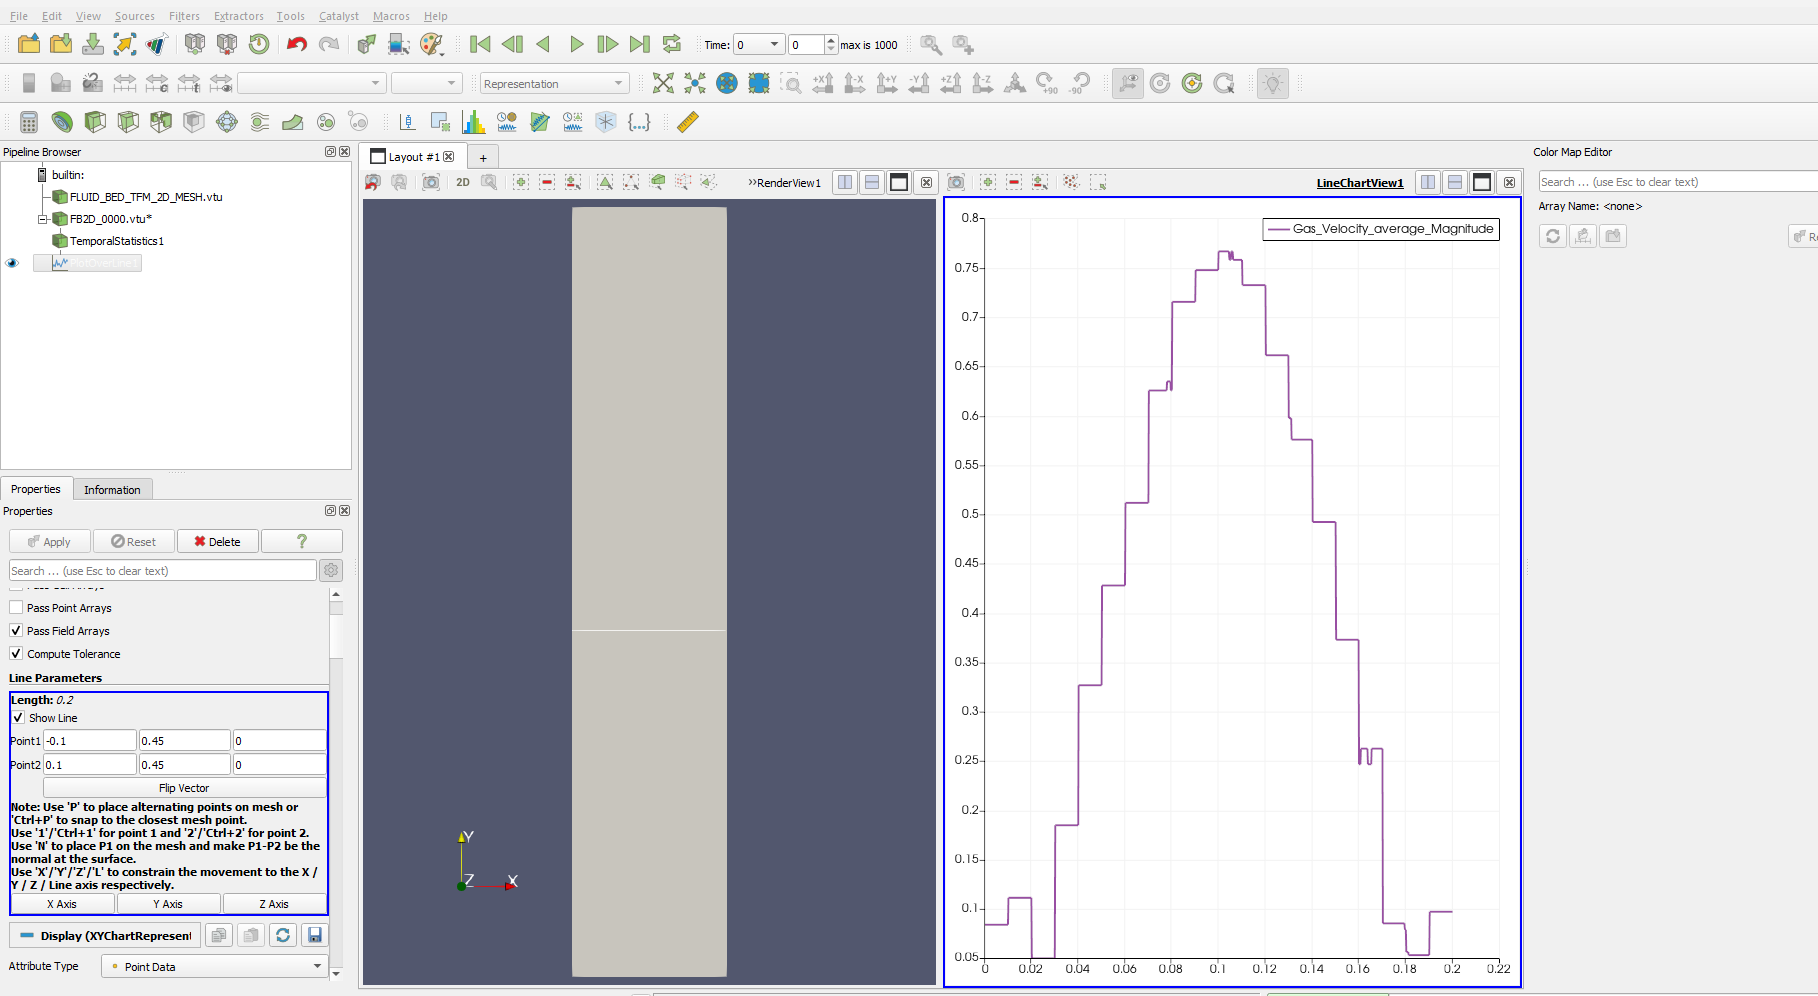
when I plot the temporal data to plot over a line, the length of a line in the X-axis is -0.1 to 0.1 getting a length of 0 to 0.20 while my geometry total X length is 0.16. how is it happening, while I change the length plot reduces. please help me.
---
### Author:  [@Kenneth\_Moreland](https://discourse.paraview.org/u/Kenneth_Moreland)
#### Post date: [July 24, 2023, 2:26pm UTC](https://discourse.paraview.org/t/create-line-plot/12561/2 "2023-07-24T14:26:51Z")
Are you sure the X length of your data is 0.16? What does the `Information` panel say about the bounds of your data?
Can you share your data?
---
### Author:  [@Chhotelal](https://discourse.paraview.org/u/Chhotelal)
#### Post date: [July 26, 2023, 6:44am UTC](https://discourse.paraview.org/t/create-line-plot/12561/3 "2023-07-26T06:44:47Z")
> [@Kenneth\_Moreland](#):
>
> `Information` panel
Thank you for your reply. I check the axis and it is given the same value.
I have one more problem when I follow these steps to plot the data, my paraview window automatically closed. I do not understand why is it happening. can you suggest the debugging?
I DES.FB1.RES in Mfix reader
DES.FB1.DES.VTK
Temporal statics
Extract region surface **(this is not taking)**
plot over line.
error is coming: ERROR: In vtkDemandDrivenPipeline.cxx, line 779
vtkPVCompositeDataPipeline (000001AEBCA01A60): Input for connection index 0 on input port index 0 for algorithm vtkDataSetRegionSurfaceFilter (000001AEB673C550) is of type vtkPolyData, but a vtkUnstructuredGrid is required.
ERROR: In vtkDemandDrivenPipeline.cxx, line 779
vtkPVCompositeDataPipeline (000001AEBCA01A60): Input for connection index 0 on input port index 0 for algorithm vtkDataSetRegionSurfaceFilter (000001AEB673C550) is of type vtkPolyData, but a vtkUnstructuredGrid is required.
---
### Author:  [@Kenneth\_Moreland](https://discourse.paraview.org/u/Kenneth_Moreland)
#### Post date: [July 26, 2023, 2:48pm UTC](https://discourse.paraview.org/t/create-line-plot/12561/4 "2023-07-26T14:48:07Z")
The problem is that you are adding `Extract Region Surface` on something that is already a surface. ParaView should not have let you add the filter, but the filter does not support this type of data.
If you _really_ want to use this filter, you can first add `Clean to Grid` first. But in the end you might end up with what you started with because you are extracting a surface from a surface. It might work to just not run this filter.
---
### Author:  [@Chhotelal](https://discourse.paraview.org/u/Chhotelal)
#### Post date: [July 28, 2023, 6:59am UTC](https://discourse.paraview.org/t/create-line-plot/12561/5 "2023-07-28T06:59:38Z")
> [@Chhotelal](#):
>
> I DES.FB1.RES in Mfix reader
> DES.FB1.DES.VTK
Thank you for your reply then how can I plot the smooth plot in the DEM case?
Also, I have doubts when I upload the data file DES.FB1.RES in Mfix reader
DES.FB1.DES.VTK my preview window automatically closed. can you tell me what is the reason behind it.