# CSV file to 3D graph
**URL:** https://discourse.paraview.org/t/csv-file-to-3d-graph/12178
**Category:** ParaView Support
**Created:** [May 29, 2023, 3:04pm UTC](https://discourse.paraview.org/t/csv-file-to-3d-graph/12178 "2023-05-29T15:04:46Z")
**Posts on this page:** 12
**Page:** 1
### Author:  [@yaelmedley](https://discourse.paraview.org/u/yaelmedley)
#### Post date: [May 29, 2023, 3:04pm UTC](https://discourse.paraview.org/t/csv-file-to-3d-graph/12178/1 "2023-05-29T15:04:46Z")
I have been able to import a CSV file, but I’m having trouble figuring out how to make a 3D surface graph based on the data. Do you have any suggestions?
---
### Author:  [@mwestphal](https://discourse.paraview.org/u/mwestphal)
#### Post date: [May 30, 2023, 7:36am UTC](https://discourse.paraview.org/t/csv-file-to-3d-graph/12178/2 "2023-05-30T07:36:24Z")
Hi @yaelmedley , and welcome
TableToPoints + Delaunay2D ?
Best,
---
### Author:  [@Francois\_Mazen](https://discourse.paraview.org/u/Francois_Mazen)
#### Post date: [May 30, 2023, 7:40am UTC](https://discourse.paraview.org/t/csv-file-to-3d-graph/12178/3 "2023-05-30T07:40:57Z")
Hi @yaelmedley
After loading your CSV file in ParaView, you may use the “Table to Points” or “Table to Structured Grid” filters to transform your data.
---
### Author:  [@yaelmedley](https://discourse.paraview.org/u/yaelmedley)
#### Post date: [June 2, 2023, 2:47pm UTC](https://discourse.paraview.org/t/csv-file-to-3d-graph/12178/4 "2023-06-02T14:47:16Z")
Hello Francois,
Thank you for your reply. I tried your suggestions, but I didn’t get results that made sense. I have attached my csv file. I don’t know if I have it formated correctly. The top row should be one axis, the left column should be another axis and the energies in the grid should be the third axis. Do you have any suggestions? I’m trying to make a surface plot.
Thank you so much,
Yael
[azi\_to\_c5\_pre\_indole.csv](https://discourse.paraview.org/uploads/short-url/aj2boX0o53VUvpx7wIqevGjcZT1.csv) (937 Bytes)
---
### Author:  [@Francois\_Mazen](https://discourse.paraview.org/u/Francois_Mazen)
#### Post date: [June 2, 2023, 4:43pm UTC](https://discourse.paraview.org/t/csv-file-to-3d-graph/12178/5 "2023-06-02T16:43:55Z")
Thanks for the example! I understand that your csv contains only the field value, so the target VTK Data Object should be an image data.
You can easily convert your csv file to a vtkImageData with a python script. We recently published a blog explaining the basic steps:
[https://www.kitware.com/easy-data-conversion-to-vtk-with-python/](https://www.kitware.com/easy-data-conversion-to-vtk-with-python/)
Best,
---
### Author:  [@yaelmedley](https://discourse.paraview.org/u/yaelmedley)
#### Post date: [June 2, 2023, 4:55pm UTC](https://discourse.paraview.org/t/csv-file-to-3d-graph/12178/6 "2023-06-02T16:55:30Z")
Thank you Francois,
I am new to Python, so this may take me a while to figure out. After I have made a VTK file, would I load it in Paraview and then follow one of your previous instructions for making a graph?
Thanks again,
Yael
---
### Author:  [@Francois\_Mazen](https://discourse.paraview.org/u/Francois_Mazen)
#### Post date: [June 6, 2023, 10:20am UTC](https://discourse.paraview.org/t/csv-file-to-3d-graph/12178/7 "2023-06-06T10:20:25Z")
Here a quick (& dirty) script to convert your CSV data to vtkImageData:
```python
from vtk import vtkImageData
from vtk import vtkXMLImageDataWriter
from vtkmodules.vtkCommonCore import VTK_DOUBLE
import csv
imageData = vtkImageData()
with open('azi_to_c5_pre_indole.csv', newline='') as csvfile:
csv_content = csv.reader(csvfile, delimiter=',', quotechar='|')
x_index=0
y_index=0
z_index=0
row_count = sum(1 for row in csv_content)
csvfile.seek(0)
csv_content = csv.reader(csvfile)
first_row = True
for row in csv_content:
if first_row:
imageData.SetDimensions(row_count, len(row), 1)
imageData.AllocateScalars(VTK_DOUBLE, 1)
first_row = False
y_index=0
for value in row:
imageData.SetScalarComponentFromDouble(x_index, y_index, z_index, 0, float(value))
y_index +=1
x_index += 1
writer = vtkXMLImageDataWriter()
writer.SetFileName("output.vti")
writer.SetInputData(imageData)
writer.Write()
```
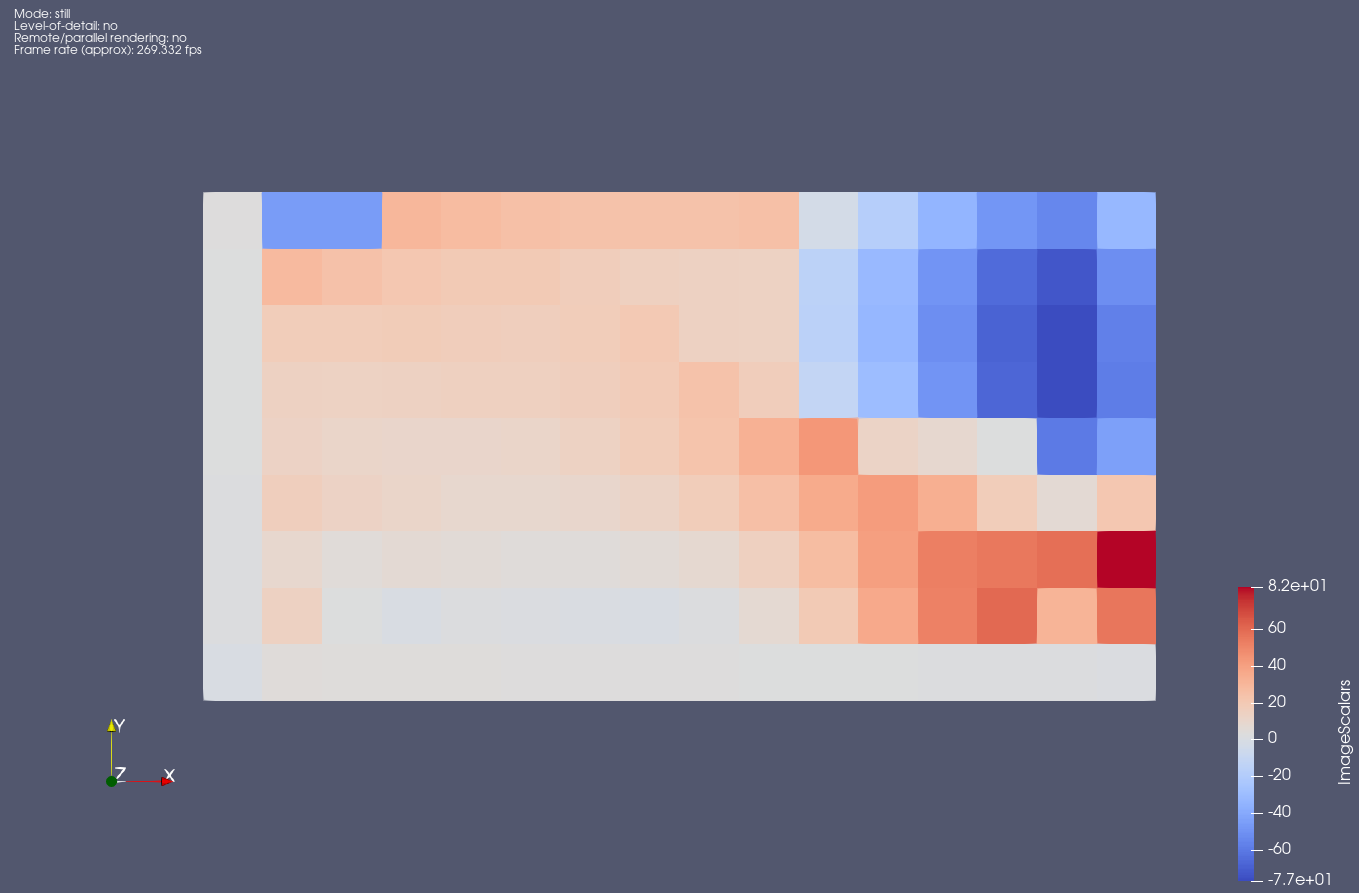
In ParaView I get this visualization:
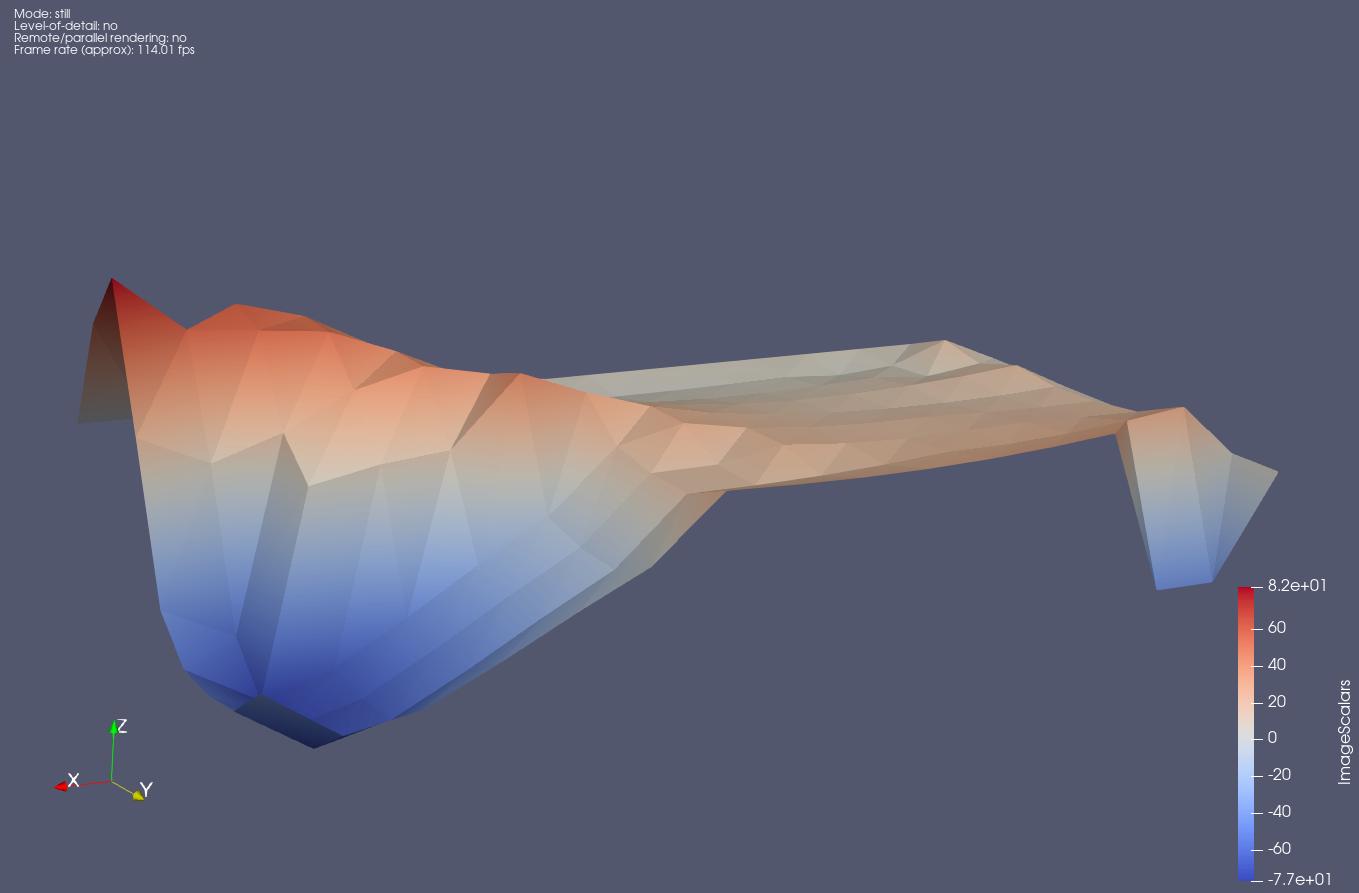
And after a Warp by Scalar Filter:
Best,
François
---
### Author:  [@yaelmedley](https://discourse.paraview.org/u/yaelmedley)
#### Post date: [June 6, 2023, 1:03pm UTC](https://discourse.paraview.org/t/csv-file-to-3d-graph/12178/8 "2023-06-06T13:03:23Z")
Francois,
Thank you so much. I will let you know how it goes.
Best,
Yael
---
### Author:  [@yaelmedley](https://discourse.paraview.org/u/yaelmedley)
#### Post date: [June 6, 2023, 6:19pm UTC](https://discourse.paraview.org/t/csv-file-to-3d-graph/12178/9 "2023-06-06T18:19:13Z")
Francois,
Do you know if there is a way of rotating the graph?
Thank you,
Yael
---
### Author:  [@yaelmedley](https://discourse.paraview.org/u/yaelmedley)
#### Post date: [June 9, 2023, 1:47pm UTC](https://discourse.paraview.org/t/csv-file-to-3d-graph/12178/10 "2023-06-09T13:47:16Z")
Hello Francois,
I tried to run the python code you gave me and I got this error:
Traceback (most recent call last):
File “graph2.py”, line 2, in
from vtk import vtkImageData
ModuleNotFoundError: No module named ‘vtk’
I asked the people at hpc that I am using. They aren’t familiar with vtk. Isn’t something that I need to get access to, and how do I do that?
Thank you,
Yael
---
### Author:  [@Francois\_Mazen](https://discourse.paraview.org/u/Francois_Mazen)
#### Post date: [June 9, 2023, 1:57pm UTC](https://discourse.paraview.org/t/csv-file-to-3d-graph/12178/11 "2023-06-09T13:57:04Z")
You should install VTK Python first. The easiest way is using pip: `pip install vtk`.
More information here:
[https://docs.vtk.org/en/latest/getting\_started/index.html#using-python](https://docs.vtk.org/en/latest/getting_started/index.html#using-python)
---
### Author:  [@yaelmedley](https://discourse.paraview.org/u/yaelmedley)
#### Post date: [June 9, 2023, 2:21pm UTC](https://discourse.paraview.org/t/csv-file-to-3d-graph/12178/12 "2023-06-09T14:21:01Z")
I don’t have pip installed. Do you think I should try installing vtk another way, or try to install pip first?