# CSV to vectors works, but streamlines not generated
**URL:** https://discourse.paraview.org/t/csv-to-vectors-works-but-streamlines-not-generated/13158
**Category:** ParaView Support
**Created:** [November 1, 2023, 6:30pm UTC](https://discourse.paraview.org/t/csv-to-vectors-works-but-streamlines-not-generated/13158 "2023-11-01T18:30:17Z")
**Posts on this page:** 8
**Page:** 1
### Author:  [@rcorredorj](https://discourse.paraview.org/u/rcorredorj)
#### Post date: [November 1, 2023, 6:30pm UTC](https://discourse.paraview.org/t/csv-to-vectors-works-but-streamlines-not-generated/13158/1 "2023-11-01T18:30:17Z")
Hi guys,
I have a CSV where each row represent a point and a velocity vector, so 6 columns: x, y, z, and v\_x, v\_y, v\_z. I use a “Table to Points” filter followed by a “Merge Vector Components” which allow me to visualize the vectors properly:
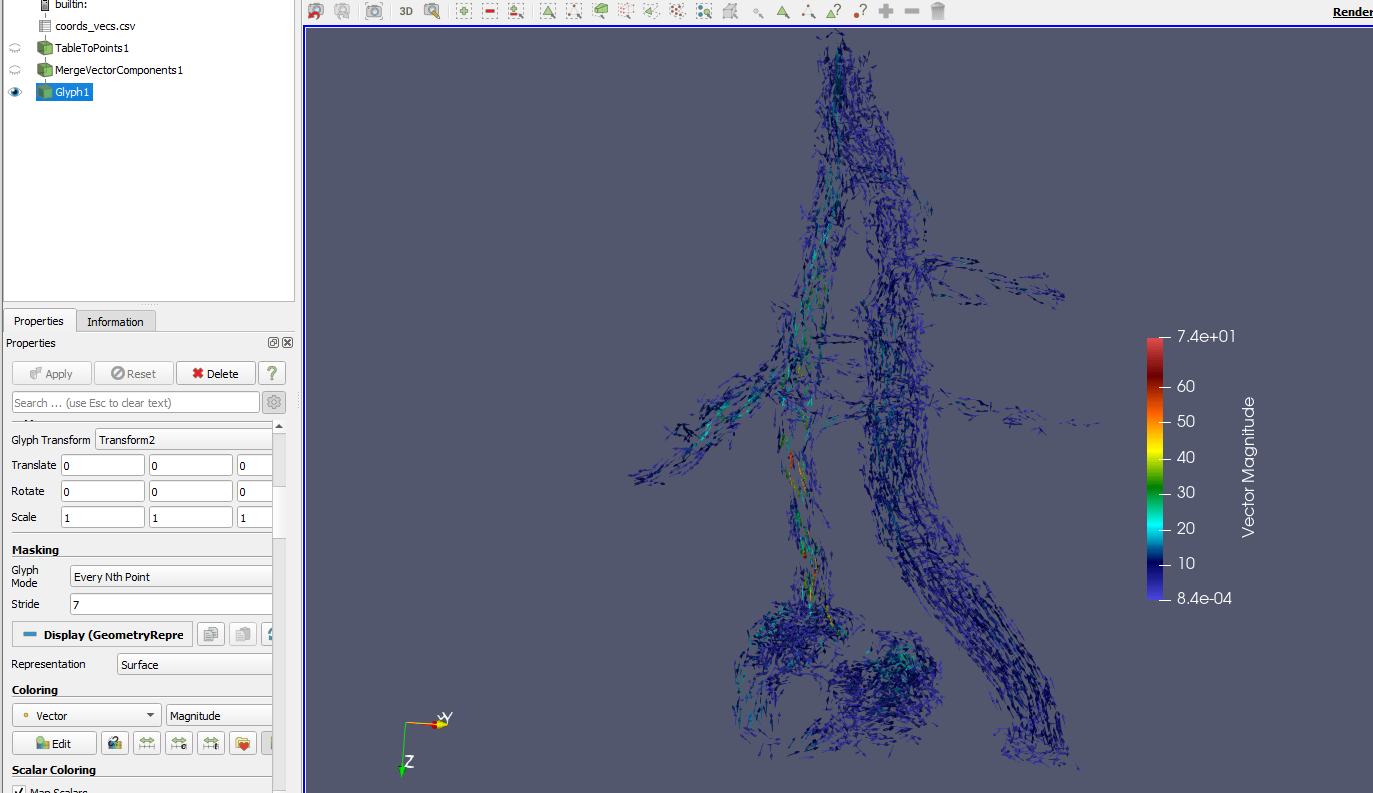
However, when using a “StreamTracer” using the vectors that are properly rendered, I don’t find a way to generate the streamlines on this vector field. I tried using the sphere and the line with different resolutions and changing all the parameters, nothing works. I tried extracting points from the PointSet and using the “StreamTracer with Source”, but also didn’t work. I don’t know if it has to be with the fact that the TableToPoints filter interprets the object as a “Polygonal Mesh”, but I also tried to generate a Structured volume with the filters, but I loose the vectors I already have.
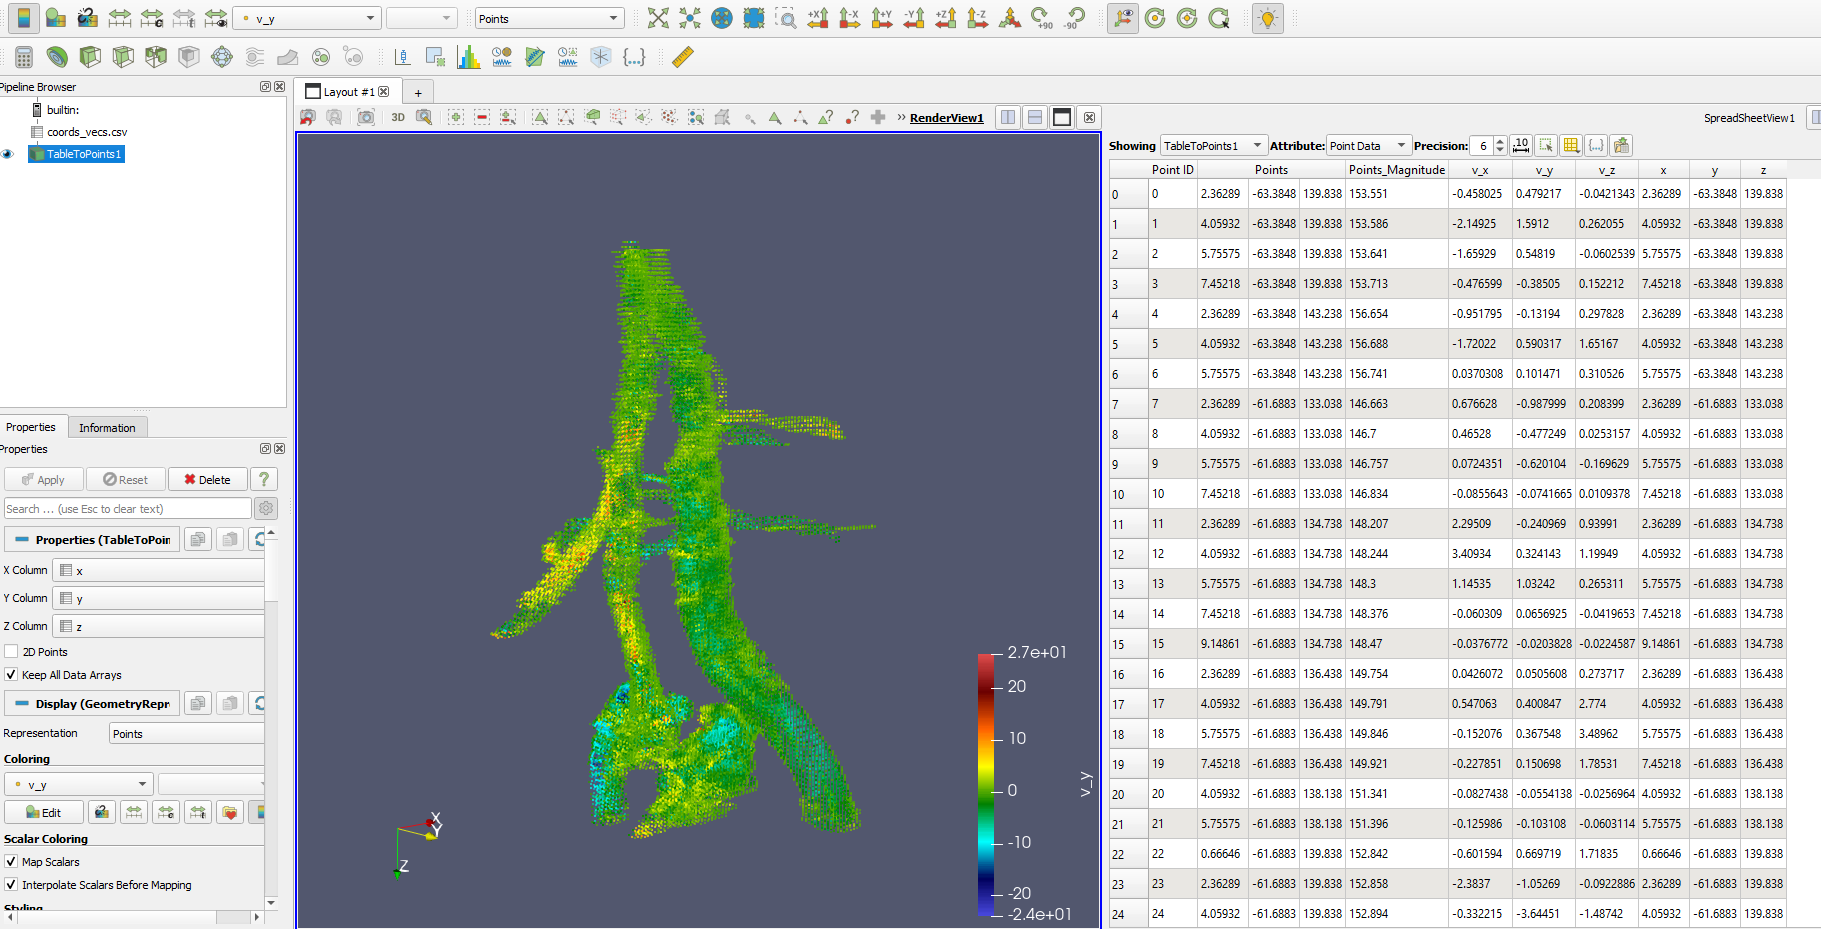
Any suggestion ? Any thoughts on why I cannot generate the streamlines if I have a quite dense vector field ?
Thanks !
RaC
---
### Author:  [@mwestphal](https://discourse.paraview.org/u/mwestphal)
#### Post date: [November 2, 2023, 9:26am UTC](https://discourse.paraview.org/t/csv-to-vectors-works-but-streamlines-not-generated/13158/2 "2023-11-02T09:26:05Z")
You need a volume to generate streamlines, use `ResampleToImage`.
---
### Author:  [@rcorredorj](https://discourse.paraview.org/u/rcorredorj)
#### Post date: [November 2, 2023, 11:02am UTC](https://discourse.paraview.org/t/csv-to-vectors-works-but-streamlines-not-generated/13158/3 "2023-11-02T11:02:38Z")
Thanks for your reply.
I tried the ResampleToImage with the default resolution of 100x100x100 and a finer one, and the respective vectors in the dataset are not resampled/interpolated.

I also tried before the “Point Volume Interpolator” with the default VoronoiKernel, and it creates a structured volume with some content in the “cells”, but I don’t get why I get vectors with non-zero values in areas that I didn’t have any point with values in empty regions.
Any suggestion to keep the same vectors I have in my PointSet but just mapping them in the structured volume with a basic interpolator?
Cheers!
RaC
---
### Author:  [@mwestphal](https://discourse.paraview.org/u/mwestphal)
#### Post date: [November 2, 2023, 1:33pm UTC](https://discourse.paraview.org/t/csv-to-vectors-works-but-streamlines-not-generated/13158/4 "2023-11-02T13:33:10Z")
Please share your data.
---
### Author:  [@Kenneth\_Moreland](https://discourse.paraview.org/u/Kenneth_Moreland)
#### Post date: [November 2, 2023, 1:56pm UTC](https://discourse.paraview.org/t/csv-to-vectors-works-but-streamlines-not-generated/13158/5 "2023-11-02T13:56:04Z")
> [@rcorredorj](#):
>
> I also tried before the “Point Volume Interpolator” with the default VoronoiKernel, and it creates a structured volume with some content in the “cells”, but I don’t get why I get vectors with non-zero values in areas that I didn’t have any point with values in empty regions.
The Voronoi kernel fills each point in the sample grid with the values from the nearest point in the point cloud. That means you don’t have to worry about the sampling distance for points in the cloud, but it also means that those in the parts at the edges may be filled with data that is far away. (That is, the nearest cloud point might be quite far away.)
If you don’t like that behavior, you could change the kernel type to something like Gaussian. When using the Gaussian kernel, you have to specify a radius that indicates the sphere of influence each cloud point has. This has the advantage that parts of the sampling grid that are not close to any cloud points are zero. But it has the disadvantage that you have to get the radius right. If the radius is too small, there will be holes in the middle of the grid. If the radius is too big, then data from points will blend together, effectively blurring your data.
---
### Author:  [@rcorredorj](https://discourse.paraview.org/u/rcorredorj)
#### Post date: [November 2, 2023, 4:12pm UTC](https://discourse.paraview.org/t/csv-to-vectors-works-but-streamlines-not-generated/13158/6 "2023-11-02T16:12:32Z")
Here you have a subset of the data. Still don’t manage to produce a proper viz of the streamlines though there seems to be a reasonable vector field
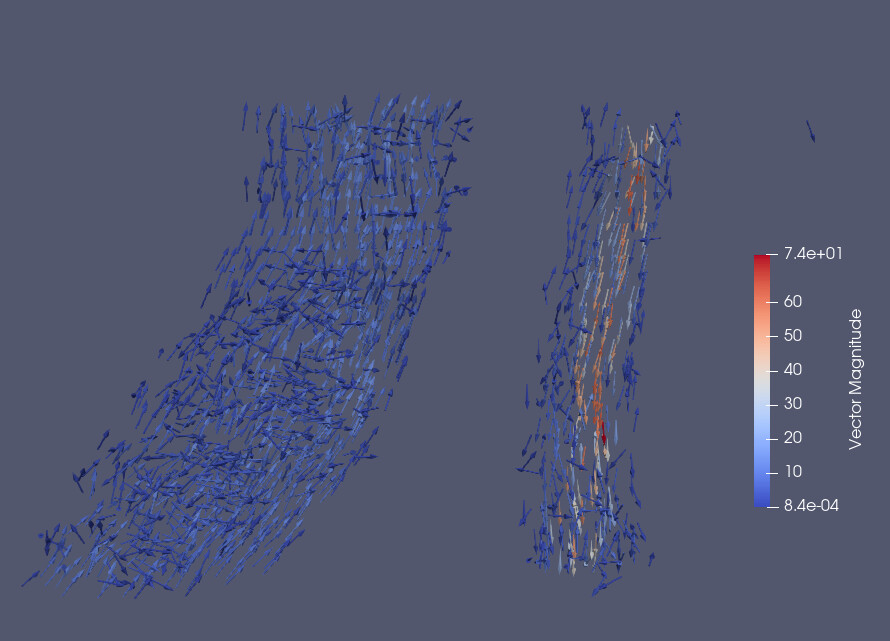
[subset\_0.vtu](https://discourse.paraview.org/uploads/short-url/vGrBnjBpUrymj5ot5SxTUKH6it4.vtu) (551.9 KB)
---
### Author:  [@rcorredorj](https://discourse.paraview.org/u/rcorredorj)
#### Post date: [November 2, 2023, 4:32pm UTC](https://discourse.paraview.org/t/csv-to-vectors-works-but-streamlines-not-generated/13158/7 "2023-11-02T16:32:12Z")
Thanks for your suggestions. I 'm also trying it with a fine grid. Seems to be ok, but need to do more tests.
---
### Author:  [@wascott](https://discourse.paraview.org/u/wascott)
#### Post date: [November 2, 2023, 5:25pm UTC](https://discourse.paraview.org/t/csv-to-vectors-works-but-streamlines-not-generated/13158/8 "2023-11-02T17:25:24Z")
I believe what you wan’t can’t be done. I tried the following with 5.11.1.
- Read in the dataset. It read in as a vtk unstructured mesh, as it should. I saw all of your points as … um … points. Thus, as it isn’t a .csv file, I didn’t need to run table to points.
This appears to read in correctly. Use the Spreadsheet View to see this. As Mathieu states, you have to have a solid mesh for streamlines.
- Resample to Image filter.
Spreadsheet view. There is basically no data here. See vector and v\_x, v\_y, v\_z. My guess is that the Resample to Image filter doesn’t put point data into a structured mesh of cells. Thus, this will fail.
So, what will work? Glyph filter is all I can think of. Glyph by Arrow or Line (as you are already doing).
Alan