# CSV to VTK - Custom format
**URL:** https://discourse.paraview.org/t/csv-to-vtk-custom-format/15238
**Category:** ParaView Support
**Created:** [August 14, 2024, 8:45pm UTC](https://discourse.paraview.org/t/csv-to-vtk-custom-format/15238 "2024-08-14T20:45:46Z")
**Posts on this page:** 3
**Page:** 1
### Author:  [@ParticleTruthSeeker](https://discourse.paraview.org/u/ParticleTruthSeeker)
#### Post date: [August 14, 2024, 8:45pm UTC](https://discourse.paraview.org/t/csv-to-vtk-custom-format/15238/1 "2024-08-14T20:45:46Z")
Hello,
I have an application that writes some meta data on the first three lines of a csv file and then xyz and then some quantity at those coordinates. How can one visualise this in paraview?
The TableToPoints filter doesnt recognise the first three lines and also I am not sure how I can assign the quantities in the 3rd or 4th colum to a subsequent field so i can plot histograms or PlotOverLine. Any help would be very much appreciated.
Cheers!
---
### Author:  [@mwestphal](https://discourse.paraview.org/u/mwestphal)
#### Post date: [August 19, 2024, 7:35am UTC](https://discourse.paraview.org/t/csv-to-vtk-custom-format/15238/2 "2024-08-19T07:35:50Z")
Hi @ParticleTruthSeeker
Please share your data.
Best,
---
### Author:  [@ParticleTruthSeeker](https://discourse.paraview.org/u/ParticleTruthSeeker)
#### Post date: [August 19, 2024, 10:47am UTC](https://discourse.paraview.org/t/csv-to-vtk-custom-format/15238/3 "2024-08-19T10:47:40Z")
Hello,
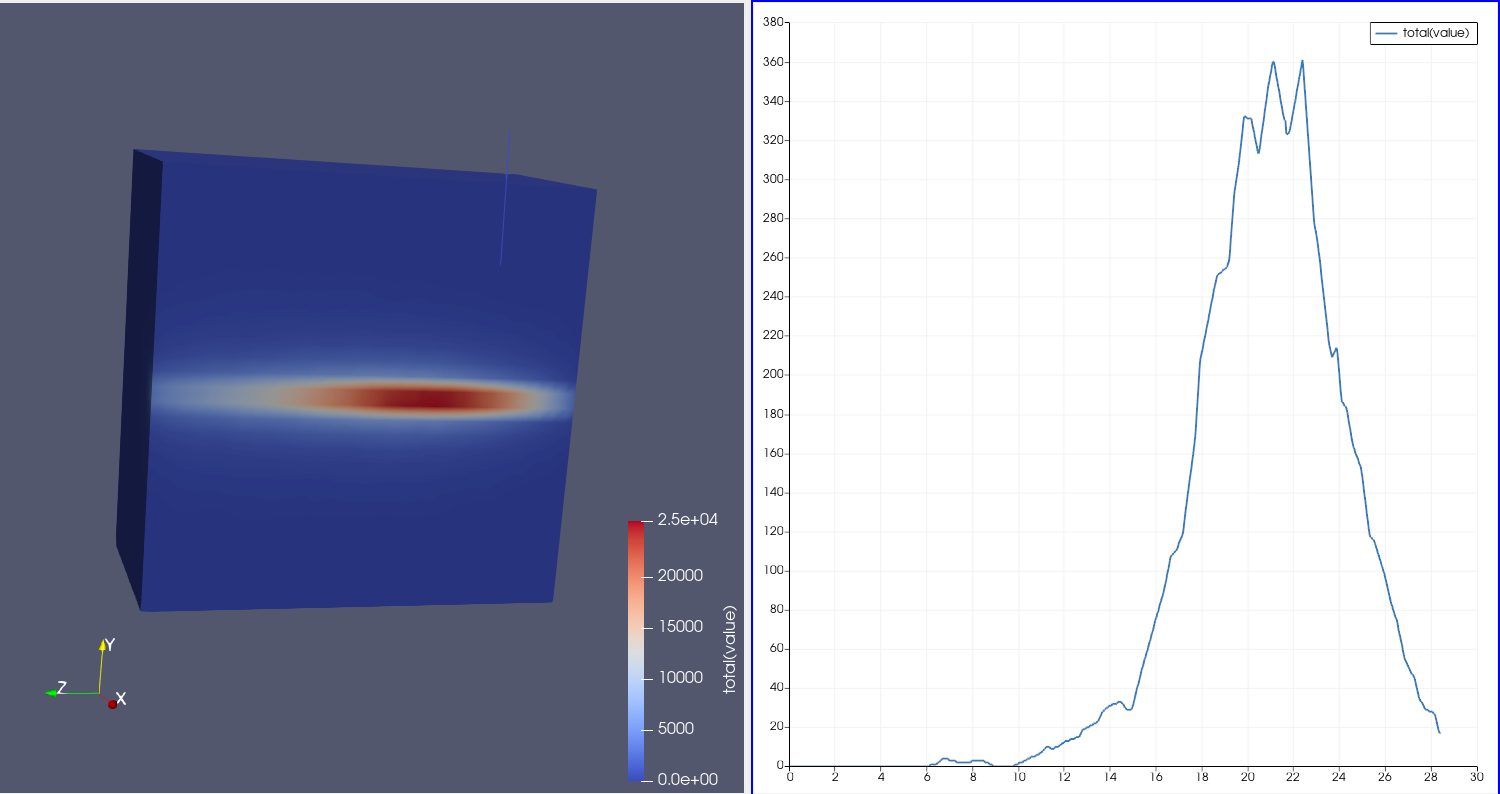
Thank you for your reply. I managed to address this question. I went from csv to structured grid and point cloud and subsequently delauney 3d which worked quite well. I am now working to generate new data sets which may be large and I am wondering if the data should be written in a hdf5 container.
Finally I quite like the plot over line. I am wondering if its possible to fit the subsequent spectrum with routines from CERN ROOT. There is a python interface to ROOT. How would one integrate this into the analysis sequence?
Many Thanks