# Custom axis
**URL:** https://discourse.paraview.org/t/custom-axis/14509
**Category:** ParaView Support
**Created:** [April 28, 2024, 11:03am UTC](https://discourse.paraview.org/t/custom-axis/14509 "2024-04-28T11:03:04Z")
**Posts on this page:** 2
**Page:** 1
### Author:  [@ado](https://discourse.paraview.org/u/ado)
#### Post date: [April 28, 2024, 11:03am UTC](https://discourse.paraview.org/t/custom-axis/14509/1 "2024-04-28T11:03:04Z")
Hi, I am new to paraview and I have the following issue: I am using MATLAB to calculate magnetic flux density around an object in space where (0,0,0) is the origin of the object. When i bring the data into Paraview, it plots well, however I would like to change axis (not just scale them) to be from -8 to 8, how can I do it?
I am showing what I mean on the figure below:
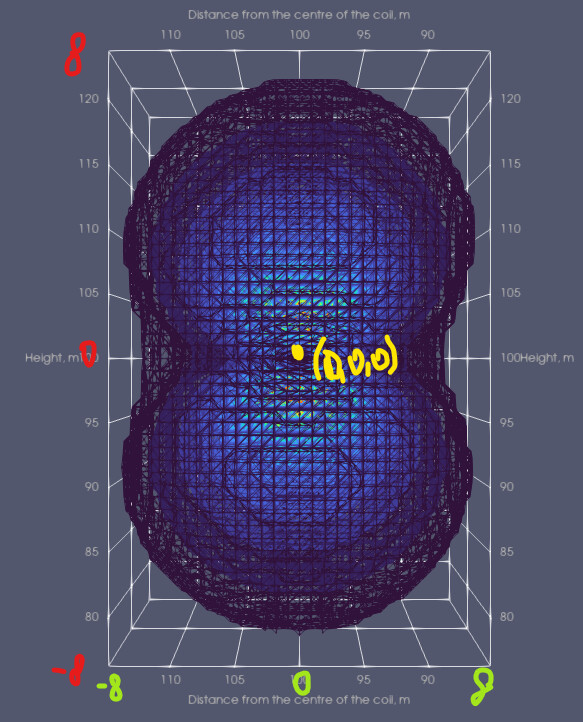
Also, while we are at it, is there a way to scale the volume scalars from 0 to 100 to other value range?
Many thanks!
---
### Author:  [@nicolas.vuaille](https://discourse.paraview.org/u/nicolas.vuaille)
#### Post date: [April 29, 2024, 11:32am UTC](https://discourse.paraview.org/t/custom-axis/14509/2 "2024-04-29T11:32:23Z")
I do not see such option in the axis config, so one would have to scale it with the `Transforming` display property.
Concerning scalars, you can either change the transfer function through the colormap editor or apply a `Python Calculator` to change the value. Something like
```auto
100 * Scalars / max(Scalars)
```