# Custom per-point glyphs
**URL:** https://discourse.paraview.org/t/custom-per-point-glyphs/8173
**Category:** ParaView Support
**Created:** [October 12, 2021, 6:31pm UTC](https://discourse.paraview.org/t/custom-per-point-glyphs/8173 "2021-10-12T18:31:04Z")
**Posts on this page:** 5
**Page:** 1
### Author:  [@woodscn](https://discourse.paraview.org/u/woodscn)
#### Post date: [October 12, 2021, 6:31pm UTC](https://discourse.paraview.org/t/custom-per-point-glyphs/8173/1 "2021-10-12T18:31:04Z")
I want to plot something like a histogram of six grid variables at each point. Is this possible to do in paraview, or am I going to be doing something more custom?
---
### Author:  [@woodscn](https://discourse.paraview.org/u/woodscn)
#### Post date: [October 12, 2021, 6:44pm UTC](https://discourse.paraview.org/t/custom-per-point-glyphs/8173/2 "2021-10-12T18:44:40Z")
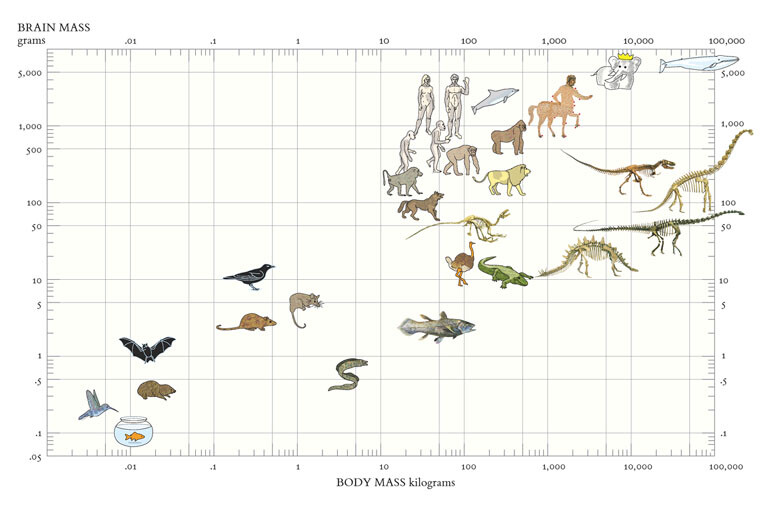
Imagine something like this, but with some sort of graph instead of a figure, and organized on a spatial grid.
---
### Author:  [@woodscn](https://discourse.paraview.org/u/woodscn)
#### Post date: [October 19, 2021, 2:38pm UTC](https://discourse.paraview.org/t/custom-per-point-glyphs/8173/3 "2021-10-19T14:38:47Z")
It looks like what I want is available in VTK: [VTK: vtkProgrammableGlyphFilter Class Reference](https://vtk.org/doc/nightly/html/classvtkProgrammableGlyphFilter.html).
Is this something I could expose in Paraview as a simple XML plugin? I suppose I’m mostly worried about the function pointer, and whether it could take a python function.
---
### Author:  [@cory.quammen](https://discourse.paraview.org/u/cory.quammen)
#### Post date: [October 19, 2021, 5:45pm UTC](https://discourse.paraview.org/t/custom-per-point-glyphs/8173/4 "2021-10-19T17:45:53Z")
Nathan,
One possibility is to use the “3D Glyphs” representation. It has an option in the Properties panel named **Use Glyph Table**. This features lets you designate a _point data_ array that specifies a glyph index. The glyph index is used to lookup a glyph within a composite dataset that you provice, which you can create with the **Group Datasets** filter.
Other relevant properties are:
- **Glyph Type** - set this to “Pipeline Connection”
- **Input** - set this to your GroupDatasets filter
- **Use Composite Glyph Table** - set this to on
When you have everything set up right, you’ll get different glyphs in your **Group Datasets** filter at different locations in your dataset.
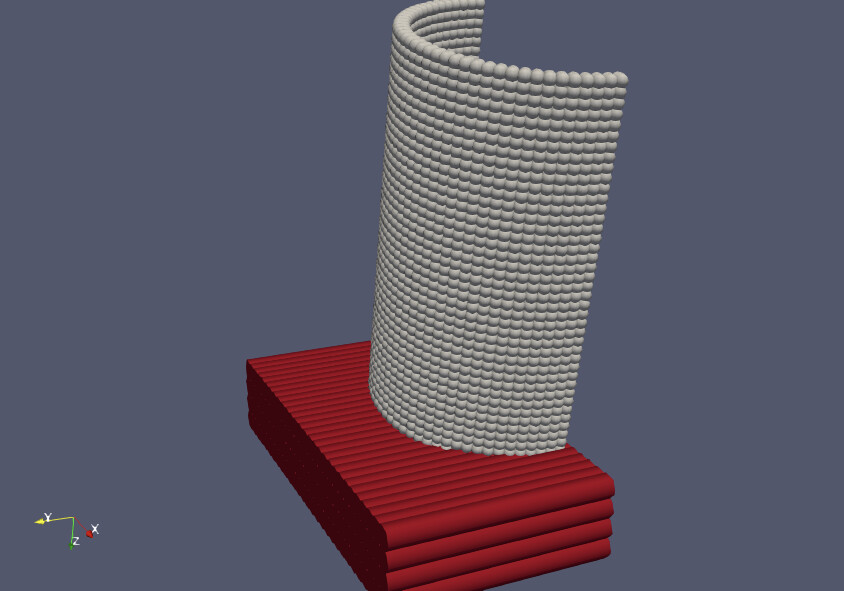
Attached is an example. It uses the can.ex2 example file and massaging the Object ID cell data array into a GlyphIndex point data array, then sets up a composite dataset with a source and cylinder. The end result is spherical glyphs on one object and cylindrical glyphs on the other.
[GlyphTable.pvsm](https://discourse.paraview.org/uploads/short-url/mk2ljnAoJQ9XECdVLIL9b5gDNC6.pvsm) (913.8 KB)
---
### Author:  [@woodscn](https://discourse.paraview.org/u/woodscn)
#### Post date: [October 20, 2021, 5:12pm UTC](https://discourse.paraview.org/t/custom-per-point-glyphs/8173/5 "2021-10-20T17:12:18Z")
This is an approach I hadn’t considered, but it seems too unwieldy for what I’d like to do. My goal is to derive each glyph from the data at the specific point, so that each glyph is a tiny histogram or line plot of a small number of variables.
The programmableGlyphFilter looks like it does exactly what I want, but I always struggle when I have to work with VTK directly.