# Customizing grid labels
**URL:** https://discourse.paraview.org/t/customizing-grid-labels/8858
**Category:** ParaView Support
**Created:** [January 28, 2022, 7:26pm UTC](https://discourse.paraview.org/t/customizing-grid-labels/8858 "2022-01-28T19:26:29Z")
**Posts on this page:** 3
**Page:** 1
### Author:  [@Victor\_Koehne\_Ramalh](https://discourse.paraview.org/u/Victor_Koehne_Ramalh)
#### Post date: [January 28, 2022, 7:26pm UTC](https://discourse.paraview.org/t/customizing-grid-labels/8858/1 "2022-01-28T19:26:29Z")
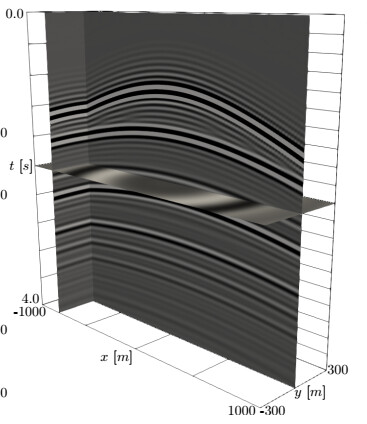
Hello all, I would like to reproduce the slice plot below on Paraview 5.9.1, showing only these 3 edges:
But when trying to tweak the Axes Grid edit window, I achieve:
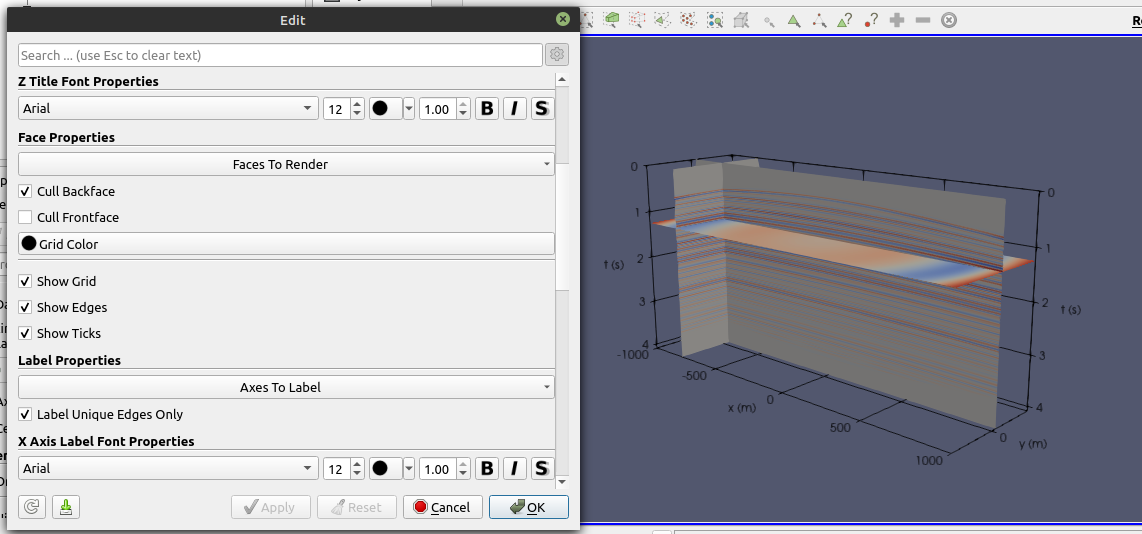
The vertical axis is replicated at the right, and I’d like to remove that. By ticking off Axes to Label → Max-Y, it is removed, but it also removes the z-axis (in-out) at the right

On Faces to Render, all options are ticked except Min-XY.
Another issue is related to using just 2 custom labels on each axis, but maintaining the ticks on the grid (as in the first figure); I could not achieve that, since when I use custom labels the grid automatically change to two lines on each dimension. Any hints?
Regards,
Victor
---
### Author:  [@Venke](https://discourse.paraview.org/u/Venke)
#### Post date: [January 31, 2022, 8:12am UTC](https://discourse.paraview.org/t/customizing-grid-labels/8858/2 "2022-01-31T08:12:49Z")
For your second problem, you could use a workaround: create a box containing your model volume and use its Data Axes Grid showing the gridlines you are missing in the Axes Grid when showing only the labels you want (turn off the labels in the Data Axes Grid).
The first problem seems like a bug to me, but there is probably a solution to that? Hopefully somebody else can answer this.
Cheers, Venke
---
### Author:  [@Victor\_Koehne\_Ramalh](https://discourse.paraview.org/u/Victor_Koehne_Ramalh)
#### Post date: [February 2, 2022, 9:01pm UTC](https://discourse.paraview.org/t/customizing-grid-labels/8858/3 "2022-02-02T21:01:51Z")
Thanks Venke, many workarounds later (set all font sizes on Data Axis Edit to 1; use X custom labels as -900,-800,-700,-600,-500,-400,-300,-100,0)
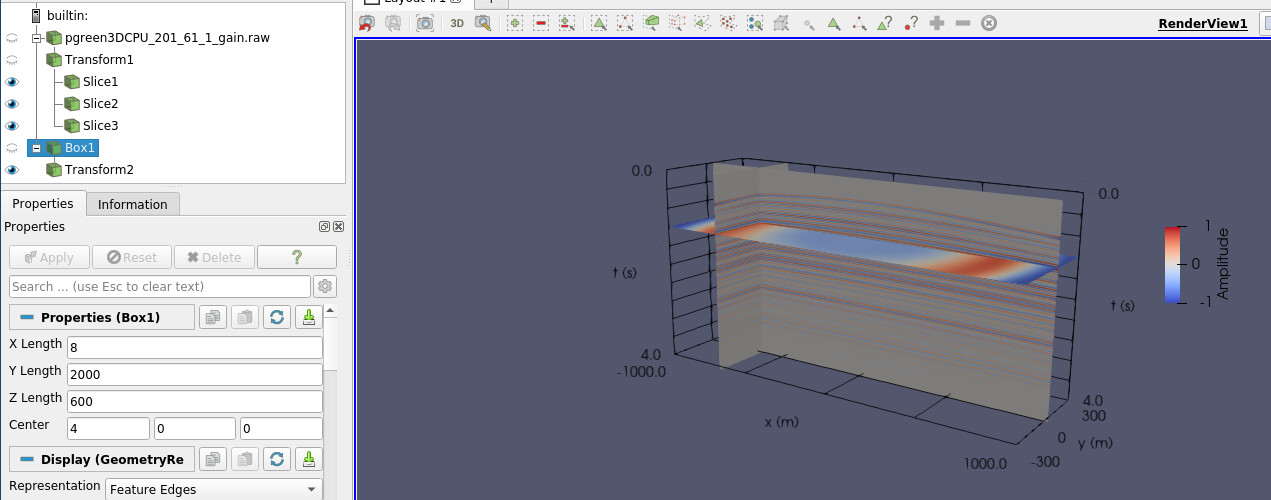
Gave up on the first problem, maybe someone finds an answer later.
Cheers
Victor