# data loss after running a script
**URL:** https://discourse.paraview.org/t/data-loss-after-running-a-script/14926
**Category:** ParaView Support
**Tags:** python
**Created:** [June 26, 2024, 7:36am UTC](https://discourse.paraview.org/t/data-loss-after-running-a-script/14926 "2024-06-26T07:36:27Z")
**Posts on this page:** 7
**Page:** 1
### Author:  [@Tang](https://discourse.paraview.org/u/Tang)
#### Post date: [June 26, 2024, 7:36am UTC](https://discourse.paraview.org/t/data-loss-after-running-a-script/14926/1 "2024-06-26T07:36:27Z")
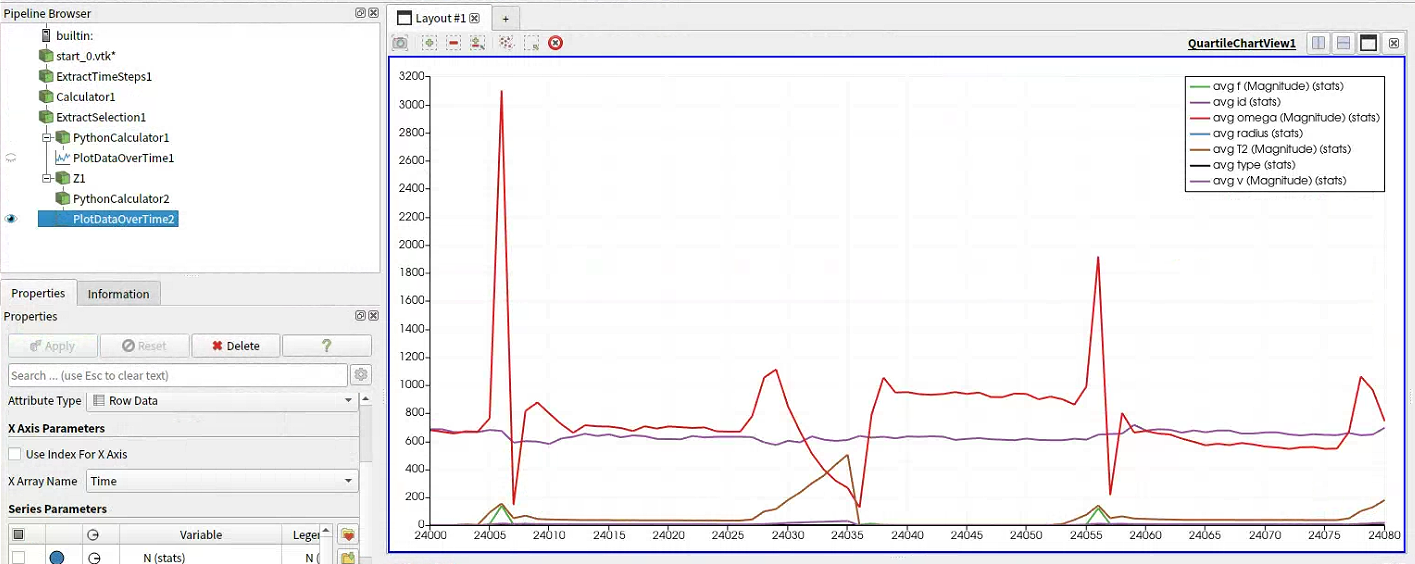
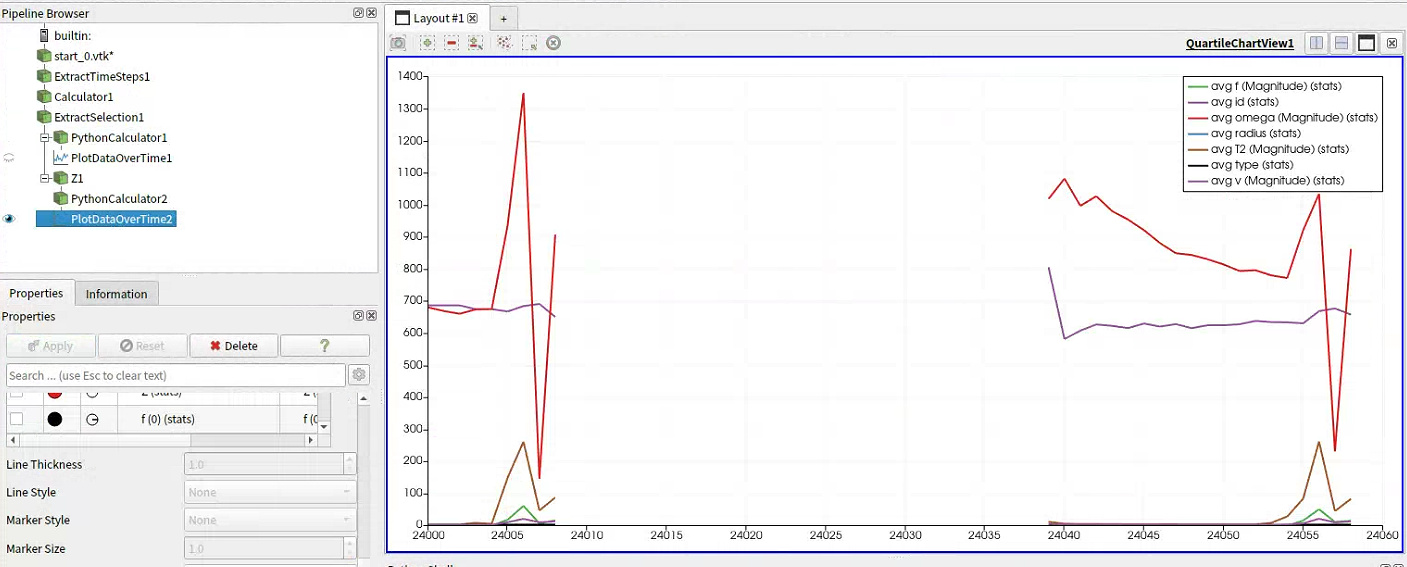
Hi all, I recorded a script in ParaView as shown in Figure 1, and then used the script in a new interface to visualize the data. However, I found that there is some missing data in the plot. Does anyone know what might be causing this?
[test06.py](https://discourse.paraview.org/uploads/short-url/bUIbpPge8BWBho0Lf0xeFcUsgBv.py) (3.5 KB)
---
### Author:  [@mwestphal](https://discourse.paraview.org/u/mwestphal)
#### Post date: [June 26, 2024, 9:54am UTC](https://discourse.paraview.org/t/data-loss-after-running-a-script/14926/2 "2024-06-26T09:54:40Z")
Please share your data
---
### Author:  [@Tang](https://discourse.paraview.org/u/Tang)
#### Post date: [June 26, 2024, 6:05pm UTC](https://discourse.paraview.org/t/data-loss-after-running-a-script/14926/4 "2024-06-26T18:05:15Z")
Thank you for your reply. Since the file is too large, I have uploaded it to Google Drive.
> **[Google Drive: Sign-in](https://accounts.google.com/v3/signin/identifier?continue=https%3A%2F%2Fdrive.google.com%2Ffile%2Fd%2F1lCm0u23NQzMmHa_egj9ronttZLoUbzAZ%2Fview%3Fusp%3Ddrivesdk&followup=https%3A%2F%2Fdrive.google.com%2Ffile%2Fd%2F1lCm0u23NQzMmHa_egj9ronttZLoUbzAZ%2Fview%3Fusp%3Ddrivesdk&ifkv=AS5LTAR4pih5_Yi_PHpmgDE2PMAHsBS1lKirw3WeyT3wr3k8OEQrCiF3qEBCWB3OdNB5XAv41rDs8g&osid=1&passive=1209600&service=wise&flowName=GlifWebSignIn&flowEntry=ServiceLogin&dsh=S-1727090063%3A1719425115645337&ddm=0)**
>
> Access Google Drive with a Google account (for personal use) or Google Workspace account (for business use).
---
### Author:  [@mwestphal](https://discourse.paraview.org/u/mwestphal)
#### Post date: [June 27, 2024, 11:34am UTC](https://discourse.paraview.org/t/data-loss-after-running-a-script/14926/5 "2024-06-27T11:34:42Z")
Your script extract timesteps from based on the time values, which are not extracted when reading a time series, sadly.
You may want to create a .series file or a .pvd file to specify the time values.
---
### Author:  [@Tang](https://discourse.paraview.org/u/Tang)
#### Post date: [June 27, 2024, 2:17pm UTC](https://discourse.paraview.org/t/data-loss-after-running-a-script/14926/6 "2024-06-27T14:17:15Z")
could you please tell me how do to specify time variable in ParaView, or does it mean that need to change the data export format?😲
---
### Author:  [@mwestphal](https://discourse.paraview.org/u/mwestphal)
#### Post date: [June 27, 2024, 2:27pm UTC](https://discourse.paraview.org/t/data-loss-after-running-a-script/14926/7 "2024-06-27T14:27:04Z")
A .series file like this let you specify the time value.
> [@Viewing .vtk files for each mesh domain in a time series - IS IT POSSIBLE?](https://discourse.paraview.org/t/viewing-vtk-files-for-each-mesh-domain-in-a-time-series-is-it-possible/577/4):
>
> If you look at the vtk.series format, it’s simply a json with the name of the file and the timestep it corresponds to. { "file-series-version" : "1.0", "files" : [{ "name" : "foo1.vtk", "time" : 0 }, { "name" : "foo2.vtk", "time" : 5.5 }, { "name" : "foo3.vtk", "time" : 11.2 }] } That how ParaView will know which file to load for a particular time. You should be able to put together such a file manually too, but doing it 93 times can be tedious :), hence my suggestion to a…
---
### Author:  [@Tang](https://discourse.paraview.org/u/Tang)
#### Post date: [June 28, 2024, 6:55am UTC](https://discourse.paraview.org/t/data-loss-after-running-a-script/14926/8 "2024-06-28T06:55:37Z")
Thank you very much. I followed your advice to address the issue of data interruptions. However, when I attempted to extract and freeze partial height data, I found that the script did not execute this step. I noticed fluctuations in the IDs of particles in the graph, which is different from the graph without using the script. Could you help me?