# Density plots appear black and buggy instead of displaying colors
**URL:** https://discourse.paraview.org/t/density-plots-appear-black-and-buggy-instead-of-displaying-colors/7503
**Category:** ParaView Support
**Created:** [June 28, 2021, 6:55pm UTC](https://discourse.paraview.org/t/density-plots-appear-black-and-buggy-instead-of-displaying-colors/7503 "2021-06-28T18:55:01Z")
**Posts on this page:** 4
**Page:** 1
### Author:  [@Felix\_Beaudoin](https://discourse.paraview.org/u/Felix_Beaudoin)
#### Post date: [June 28, 2021, 6:55pm UTC](https://discourse.paraview.org/t/density-plots-appear-black-and-buggy-instead-of-displaying-colors/7503/1 "2021-06-28T18:55:01Z")
I am trying to visualize a .vtk file produced with PyVista (python wrapper of vtk).
I opened the attached .vtk file in paraview v5.9.1, which I am running on Windows 10.
[EC.vtk](https://discourse.paraview.org/uploads/short-url/2QGssh5goQXJ2NvfLdyRoYxlewF.vtk) (3.0 MB)
The file is just an unstructured grid with data associated with each local node of the mesh. The data written in the file is a scalar field (one value per local node).
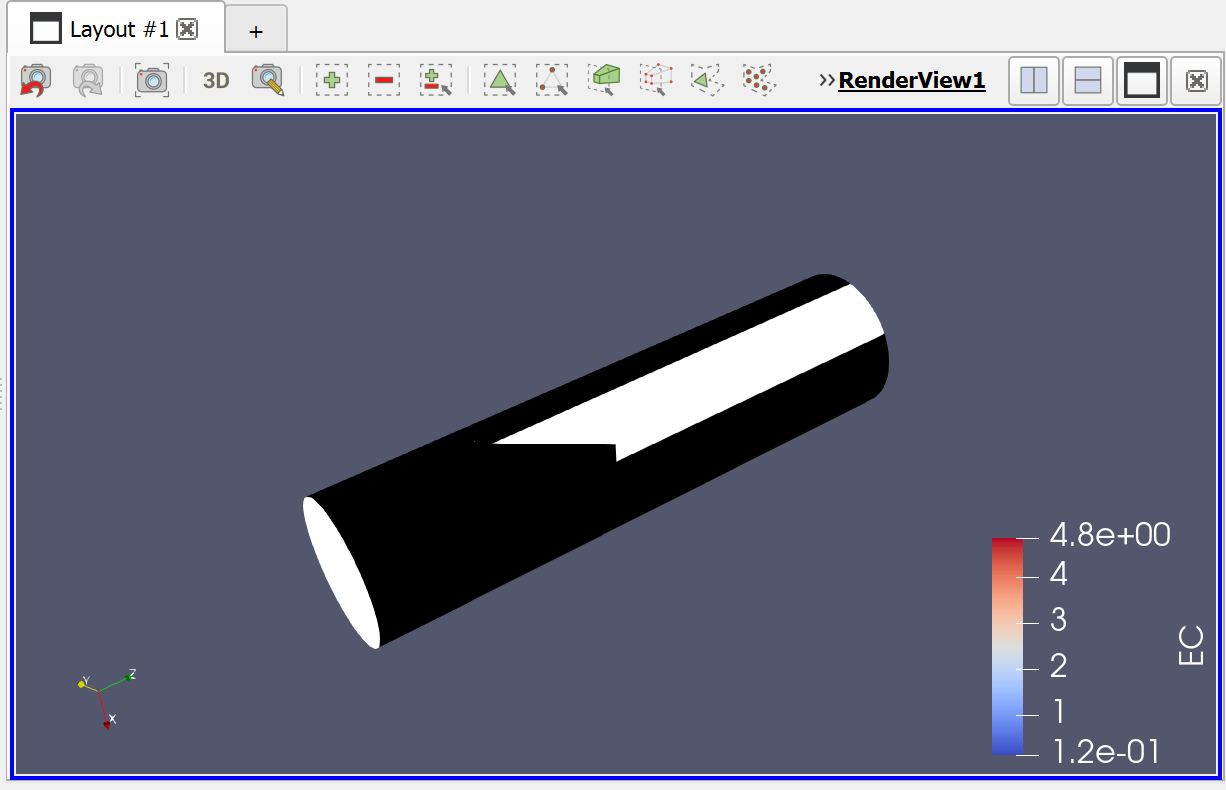
When loaded in paraview, the data does not appear correctly. Instead of seeing the expected density plot, I see some buggy black and white image:
Strange thing is, if I zoom out enough, then I can see the correct colors:
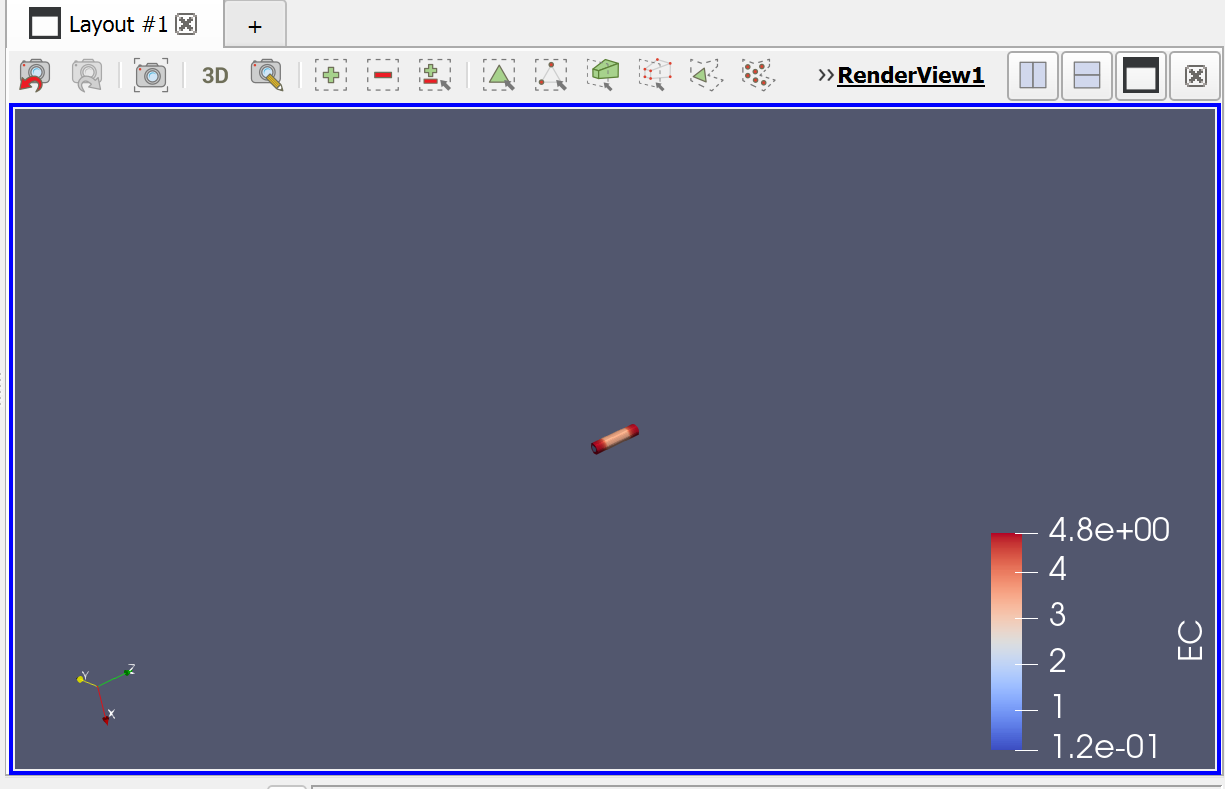
The problem is I have to zoom so far out that I am not seeing anything anymore.
Does anybody have any idea of what could cause this display issue ?
---
### Author:  [@Kenichiro-Yoshimi](https://discourse.paraview.org/u/Kenichiro-Yoshimi)
#### Post date: [July 4, 2021, 12:47am UTC](https://discourse.paraview.org/t/density-plots-appear-black-and-buggy-instead-of-displaying-colors/7503/2 "2021-07-04T00:47:30Z")
Hello,
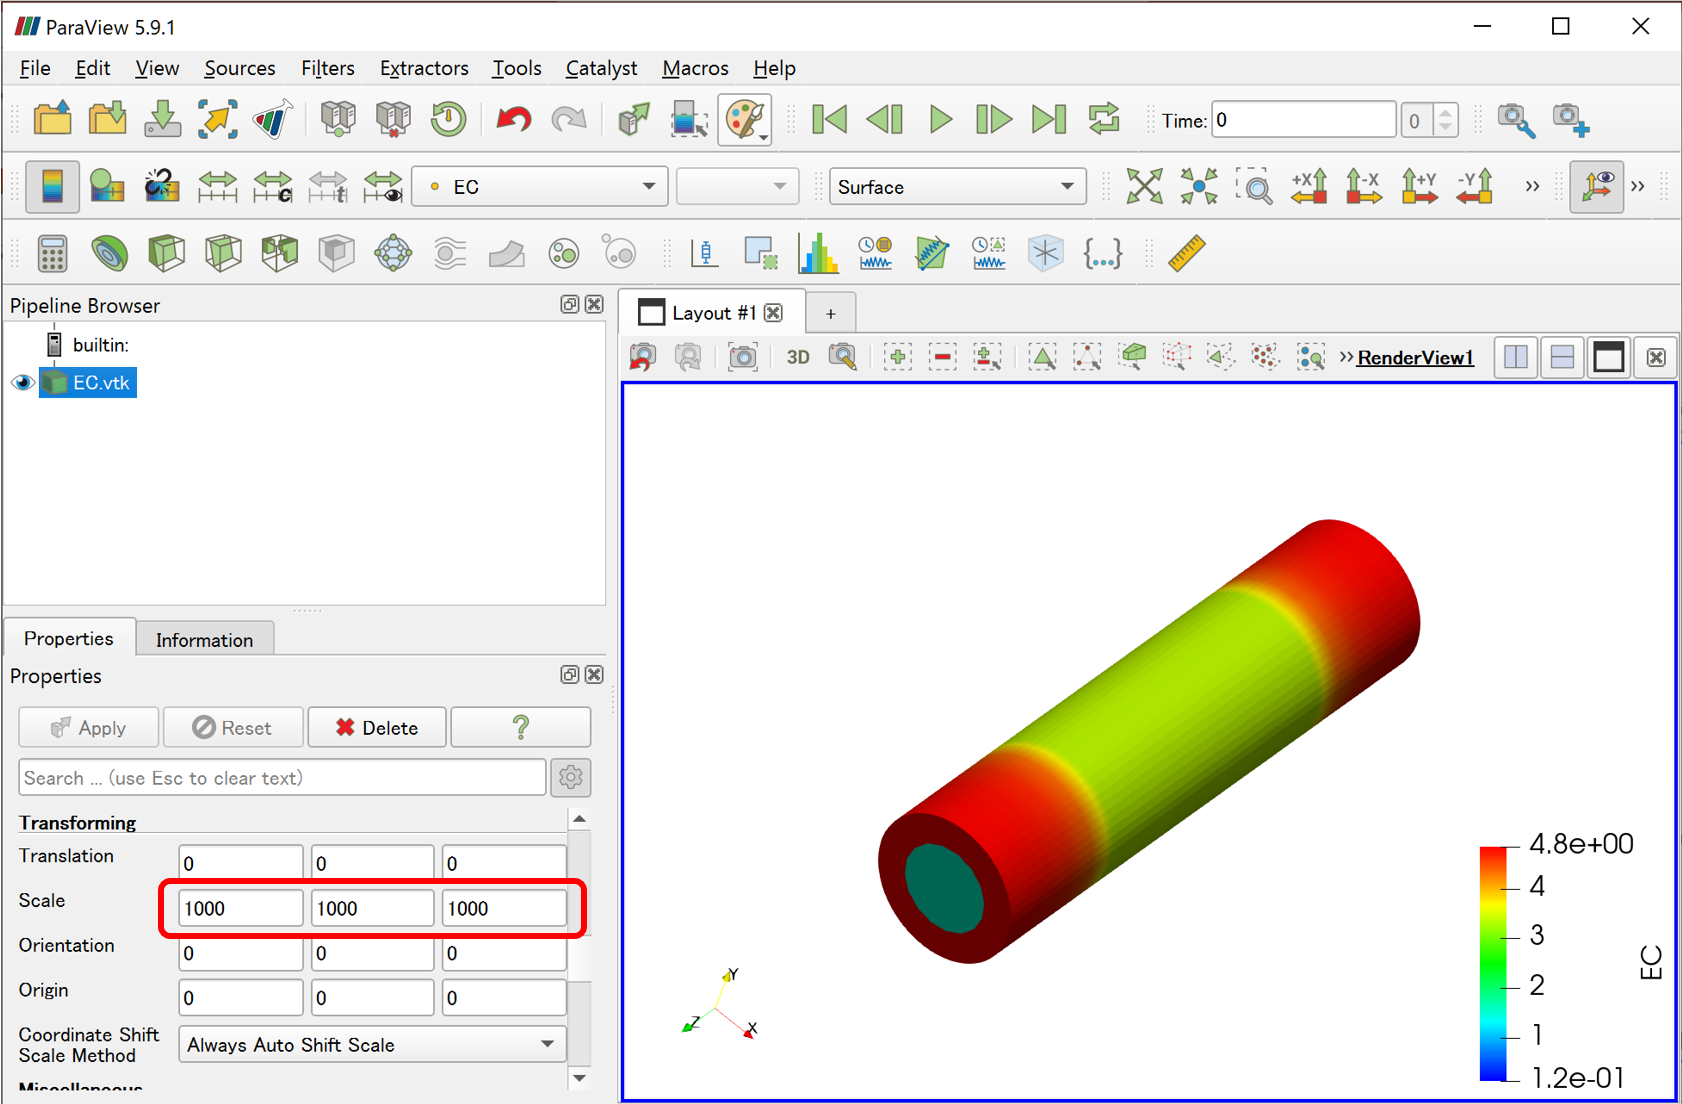
I think the problem is that the model size is too small (on the order of 1e-09). The graphics system handles the values by converting them to single precision, which may be causing the drawing failure.
In the
> Properties tab \> Transforming \> Scale
enter 1000 in each direction, and you will see an improvement.
---
### Author:  [@cory.quammen](https://discourse.paraview.org/u/cory.quammen)
#### Post date: [July 6, 2021, 11:34am UTC](https://discourse.paraview.org/t/density-plots-appear-black-and-buggy-instead-of-displaying-colors/7503/3 "2021-07-06T11:34:21Z")
Hmm, ParaView should be doing this scaling automatically. @martink thoughts on why the **Coordinate Shift Scale Method** wouldn’t work to scale up tiny point coordinate values?
---
### Author:  [@martink](https://discourse.paraview.org/u/martink)
#### Post date: [July 6, 2021, 2:13pm UTC](https://discourse.paraview.org/t/density-plots-appear-black-and-buggy-instead-of-displaying-colors/7503/4 "2021-07-06T14:13:03Z")
It could also be an issue with the normal computation. A quick fix may be if your data lacks normals to run it through “Generate Surface Normals”