# Depth averaged simulation into 3D visualization
**URL:** https://discourse.paraview.org/t/depth-averaged-simulation-into-3d-visualization/5600
**Category:** ParaView Support
**Created:** [October 19, 2020, 3:55pm UTC](https://discourse.paraview.org/t/depth-averaged-simulation-into-3d-visualization/5600 "2020-10-19T15:55:54Z")
**Posts on this page:** 4
**Page:** 1
### Author:  [@Geb1313](https://discourse.paraview.org/u/Geb1313)
#### Post date: [October 19, 2020, 3:55pm UTC](https://discourse.paraview.org/t/depth-averaged-simulation-into-3d-visualization/5600/1 "2020-10-19T15:55:54Z")
Hi,
I have a depth averaged flow simulation over a topography where the flow is described with constant velocity along the vertical flow depth and flow depth( at any point in the topography, flow velocity and depth are given). Is there a way to visualize the flow depth as “real 3D”? I mean like instead of visualizing 2m flow with color laid on the topography a "real " 2m vertical height.
Thanks!
---
### Author:  [@\_Marco](https://discourse.paraview.org/u/_Marco)
#### Post date: [November 4, 2020, 5:22pm UTC](https://discourse.paraview.org/t/depth-averaged-simulation-into-3d-visualization/5600/2 "2020-11-04T17:22:05Z")
Hi.
I am doing something very similar. My wave/flow model can output both quantity types: depth-averaged and layer.
What you can do is you artificially preprocess your data (python, xarray?), assigning the same value of your quantity at, say, two convenient levels: free surface and bottom. By so doing you actually have your data stretching over the vertical. You do that for all your gripoints, and for all timesteps.
The output could be a netcdf which is very fast in being read by PV.
Did this help?
---
### Author:  [@Geb1313](https://discourse.paraview.org/u/Geb1313)
#### Post date: [November 4, 2020, 5:36pm UTC](https://discourse.paraview.org/t/depth-averaged-simulation-into-3d-visualization/5600/3 "2020-11-04T17:36:52Z")
Can you explain it more?
I tried this in programmable filter :
`input0 = inputs[0]
h = input0.PointData[“H”]
output.PointData.append(h,“H”)
u =input0.PointData[“U”]
output.PointData.append(u,“U”)
#pdi = self.GetInput()
#pdo = self.GetOutput()
newPoints = vtk.vtkPoints()
numPoints = input0.GetNumberOfPoints()
for i in range(0, numPoints):
coord = input0.GetPoint(i)
x, y, z = coord[:3]
x = x \* 1
y = y \* 1
z =5\* h[i] + z
newPoints.InsertPoint(i, x, y, z)
output.SetPoints(newPoints)
`
Before this I used MergeBlocks filter then extractSurface filter.
This programmable filter create a geometry where the z value changes with time.
---
### Author:  [@\_Marco](https://discourse.paraview.org/u/_Marco)
#### Post date: [November 5, 2020, 7:44am UTC](https://discourse.paraview.org/t/depth-averaged-simulation-into-3d-visualization/5600/4 "2020-11-05T07:44:15Z")
Hi.
The pre-processing I had in mind, and I was mentioning in my previous post, would happen _outside_ PV, namely in Python. I am completely lost when it comes to code inside the PV env., and I cannot help you with that. So, in Python, I would manipulate my dataset so to “bake” it in a way and shape that PV likes it. I would go for netCDF format which is cross-platform, and contains all the metadata you might need, for possible future inspections.
Conceptually:
the wave model I am working with, spits out one single matlab binary file that contains all variables for all timesteps. In this example, it includes flow velocity varying over time and space:
> Velmag\_k15\_000001\_200
would mean:
quantity Velmag (velocity magnitude)
k15: layer number 15 (with k in range[0, k\_bottom]; k=0 is the actual free surface)
000001\_200: time here equals 1.2 seconds (format is HHMMss\_mms)
In my simple1D case, I merge all layers into one matrix having Nr\_of\_Layers rows and Nr\_of\_x\_gridpts columns. I repeat that, recursively, for all timesteps. The result is converted to a netcdf files (Python, xarray), saved on disk, and ingested in PV.
* * *
For depth-averaged flows, if you want to (fictitiously) recreate a filled contour effect, you need to create a matrix like the one I have described above, **with only two lines**. The content of these liens is the value of, for instance, flow velocity (or pressure, or momentum, or whatever) and:
- to the first row, you assign z coordinates of the free surface
- to the second row, you assign z coordinates of your bathymetry.
I am trying to achieve exactly that in Python now. However, the problem I am facing is that the topology of my z coordinates changes over time. And PV seems to be unable to understand that.
If you have a time-invariant z coordinate topology, your problem is very easy to solve.
So far, I could achieve something like this:
[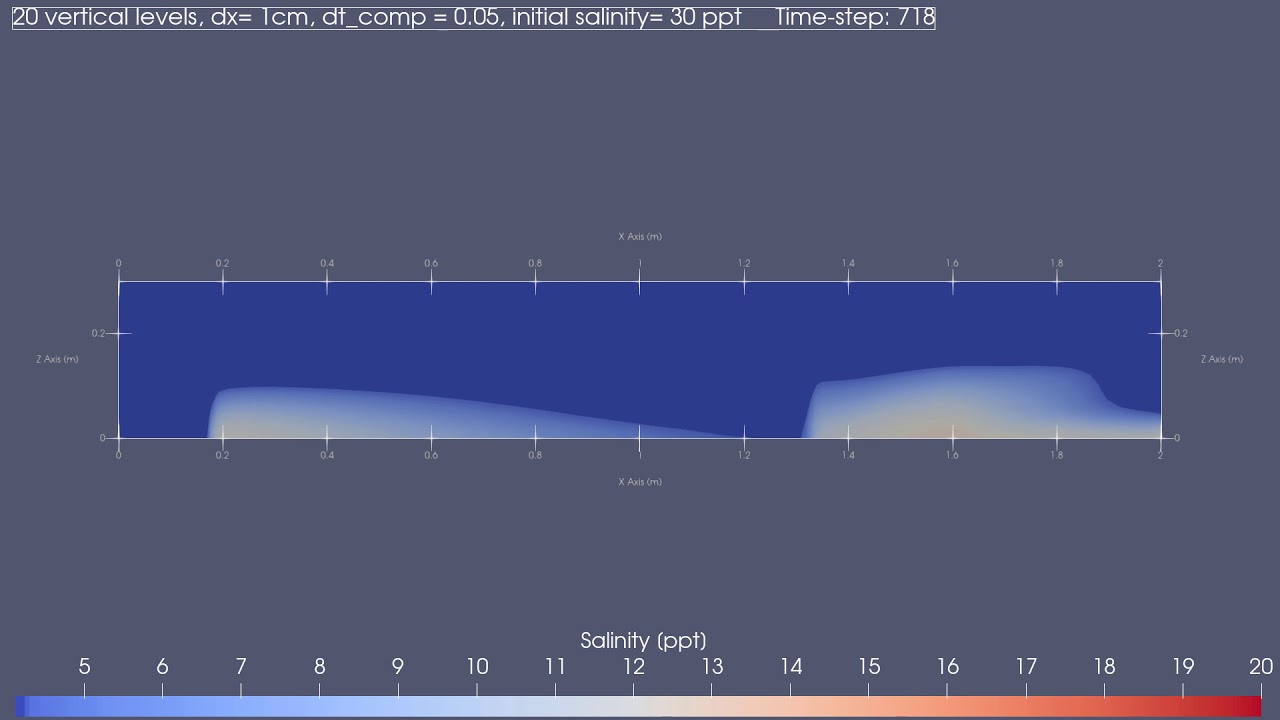 ](https://www.youtube.com/watch?v=oUNBolx8HJM)
If you want, send me two or more time-steps PLUS bathymetry of your model results and I can code it for you as an example.
Should be pretty straightforward.
Ciao.