# Difference in visualisation between point and point gaussian
**URL:** https://discourse.paraview.org/t/difference-in-visualisation-between-point-and-point-gaussian/17515
**Category:** ParaView Support
**Created:** [April 8, 2026, 11:30am UTC](https://discourse.paraview.org/t/difference-in-visualisation-between-point-and-point-gaussian/17515 "2026-04-08T11:30:28Z")
**Posts on this page:** 12
**Page:** 1
### Author:  [@cdelavegamartin](https://discourse.paraview.org/u/cdelavegamartin)
#### Post date: [April 8, 2026, 11:30am UTC](https://discourse.paraview.org/t/difference-in-visualisation-between-point-and-point-gaussian/17515/1 "2026-04-08T11:30:29Z")
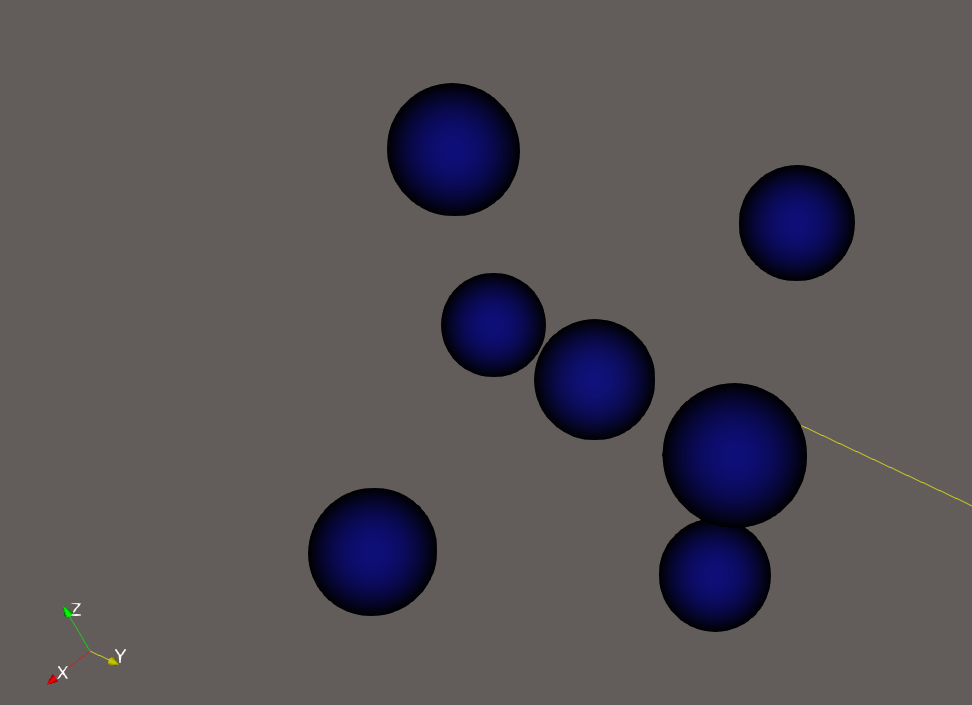
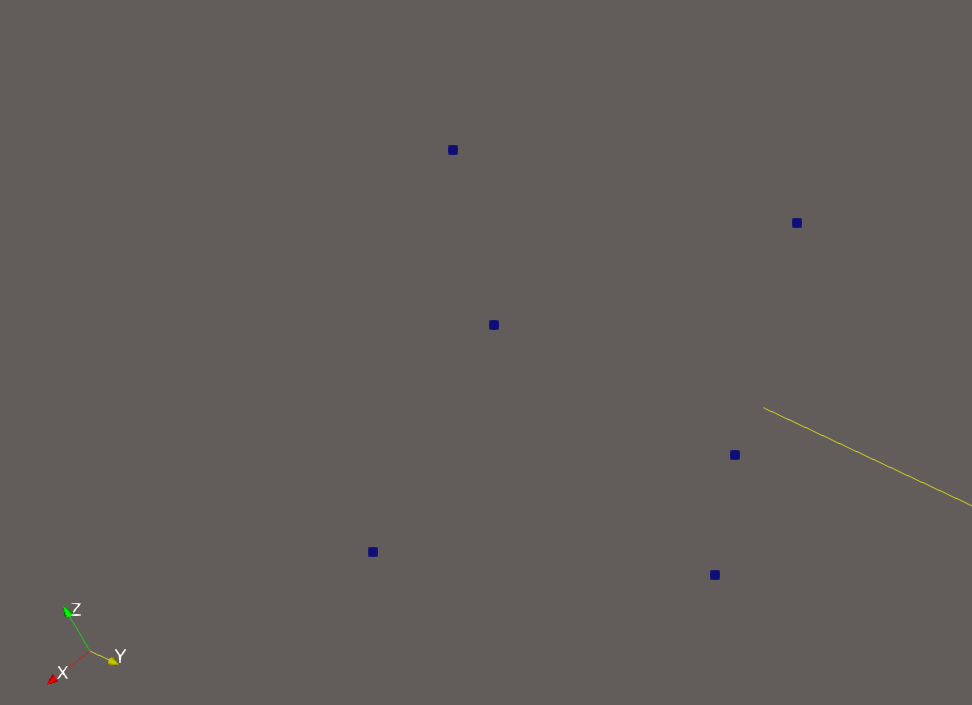
I’m visualising an scalar field clipped by scalar. It is stored as a unstructured grid, but it is technically a rectangular grid. When keeping everything the same and just switching between points and point gaussian representations some points do not appear. always the centre of these isolated “crosses” (see pics)
point gaussian:
point:
I don’t understand why this is the case, and how could I make sure they are representing the same?
---
### Author:  [@mwestphal](https://discourse.paraview.org/u/mwestphal)
#### Post date: [April 8, 2026, 11:42am UTC](https://discourse.paraview.org/t/difference-in-visualisation-between-point-and-point-gaussian/17515/2 "2026-04-08T11:42:05Z")
please share your data
---
### Author:  [@cdelavegamartin](https://discourse.paraview.org/u/cdelavegamartin)
#### Post date: [April 8, 2026, 12:20pm UTC](https://discourse.paraview.org/t/difference-in-visualisation-between-point-and-point-gaussian/17515/3 "2026-04-08T12:20:33Z")
Should I just share the vts directly? Or is there a way to export the data plus clip operations? Sorry for the dumb questions, I’m new to paraview
---
### Author:  [@cdelavegamartin](https://discourse.paraview.org/u/cdelavegamartin)
#### Post date: [April 8, 2026, 12:23pm UTC](https://discourse.paraview.org/t/difference-in-visualisation-between-point-and-point-gaussian/17515/4 "2026-04-08T12:23:51Z")
[fields\_01000.vts](https://toffeeamcouk994-my.sharepoint.com/:u:/g/personal/c_delavega_toffeex_com/IQC3XK-P_Z-XRbavO_LeIaDiAWBAhnwIiej2yTYdX2LXUFE?e=Vaxx95) this is the vts. The field I’m clipping is velocity\_overhang, with velocity\_overhang \>1e-8, see for example around:
Id: 5
Coords: (-0.00163467, 0.0461719, 0.00268881)
level\_set: 5.93118e-05
unit\_normal: (0.635867, -0.309267, -0.707126)
velocity: 6.23072e-06
velocity\_overhang: 6.23072e-06
velocity\_curv: 0
---
### Author:  [@cdelavegamartin](https://discourse.paraview.org/u/cdelavegamartin)
#### Post date: [April 8, 2026, 12:25pm UTC](https://discourse.paraview.org/t/difference-in-visualisation-between-point-and-point-gaussian/17515/5 "2026-04-08T12:25:08Z")
the velocities are scalars because it is only their magnitudes (direction is determined by the unit normal)
---
### Author:  [@mwestphal](https://discourse.paraview.org/u/mwestphal)
#### Post date: [April 8, 2026, 12:27pm UTC](https://discourse.paraview.org/t/difference-in-visualisation-between-point-and-point-gaussian/17515/6 "2026-04-08T12:27:13Z")
> [@cdelavegamartin](#):
>
> Or is there a way to export the data plus clip operations?
You can share a state file on top.
---
### Author:  [@cdelavegamartin](https://discourse.paraview.org/u/cdelavegamartin)
#### Post date: [April 8, 2026, 12:33pm UTC](https://discourse.paraview.org/t/difference-in-visualisation-between-point-and-point-gaussian/17515/7 "2026-04-08T12:33:40Z")
[mfe.pvsm](https://toffeeamcouk994-my.sharepoint.com/:u:/g/personal/c_delavega_toffeex_com/IQAoDM0v8QlvSpYk1UL0ReQZASxOrZHO4j7ky4hhMM6_6iQ?e=mwsn4n) this is the saved state
---
### Author:  [@cdelavegamartin](https://discourse.paraview.org/u/cdelavegamartin)
#### Post date: [April 8, 2026, 12:35pm UTC](https://discourse.paraview.org/t/difference-in-visualisation-between-point-and-point-gaussian/17515/8 "2026-04-08T12:35:50Z")
In that one see for example
Clip1
Id: 4483
Coords: (-0.0023582, 0.0444514, 0.00207574)
level\_set: 0.000203656
unit\_normal: (0.455418, -0.447448, -0.769665)
velocity: 0.0305517
velocity\_overhang: 0.0305517
velocity\_curv: 0
---
### Author:  [@mwestphal](https://discourse.paraview.org/u/mwestphal)
#### Post date: [April 8, 2026, 12:35pm UTC](https://discourse.paraview.org/t/difference-in-visualisation-between-point-and-point-gaussian/17515/9 "2026-04-08T12:35:55Z")
Indeed, I reproduce.
What is happening is that the Points representation is fairly limited and show points on the surface only, while the point gaussian representation should all points, whether on the surface or not.
---
### Author:  [@cdelavegamartin](https://discourse.paraview.org/u/cdelavegamartin)
#### Post date: [April 8, 2026, 12:41pm UTC](https://discourse.paraview.org/t/difference-in-visualisation-between-point-and-point-gaussian/17515/10 "2026-04-08T12:41:42Z")
Ahh, ok good to know
---
### Author:  [@cdelavegamartin](https://discourse.paraview.org/u/cdelavegamartin)
#### Post date: [April 8, 2026, 12:47pm UTC](https://discourse.paraview.org/t/difference-in-visualisation-between-point-and-point-gaussian/17515/11 "2026-04-08T12:47:58Z")
I can move the following to a new topic, but as it is on the same data, thought would be easier to quicky ask:
The other thing I noticed is that for both points and gaussian point, when I change the threshold value of the clip, let’s say to 1e-6, the value displayed is different, eg:
Clip1
Id: 33791
Coords: (-0.0023582, 0.044474, 0.00207574)
level\_set: 0.00020381
unit\_normal: (-0.497853, -0.867204, 0.00662276)
velocity: 1e-06
velocity\_overhang: 1e-06
velocity\_curv: 0
Clip1
Id: 34187
Coords: (-0.0023582, 0.044474, 0.00207574)
level\_set: 0.00020381
unit\_normal: (-0.497884, -0.867218, 0.00664792)
velocity: 1e-08
velocity\_overhang: 1e-08
velocity\_curv: 0
They are being showed in the clip, so I assume that the value has to be at least over 1e-6, but why would the hover on point dialogue show different values? Is there a way to print the full precision valu for the fields at that point?
---
### Author:  [@mwestphal](https://discourse.paraview.org/u/mwestphal)
#### Post date: [April 8, 2026, 12:50pm UTC](https://discourse.paraview.org/t/difference-in-visualisation-between-point-and-point-gaussian/17515/12 "2026-04-08T12:50:45Z")
> [@cdelavegamartin](#):
>
> hover on point dialogue show different values?
Precision
> Is there a way to print the full precision valu for the fields at that point?
- Spreadsheet
- Edit → Settings → Precision