# discrete color scheme for vtk data
**URL:** https://discourse.paraview.org/t/discrete-color-scheme-for-vtk-data/15973
**Category:** ParaView Support
**Created:** [January 13, 2025, 12:27pm UTC](https://discourse.paraview.org/t/discrete-color-scheme-for-vtk-data/15973 "2025-01-13T12:27:11Z")
**Posts on this page:** 3
**Page:** 1
### Author:  [@otaolafr](https://discourse.paraview.org/u/otaolafr)
#### Post date: [January 13, 2025, 12:27pm UTC](https://discourse.paraview.org/t/discrete-color-scheme-for-vtk-data/15973/1 "2025-01-13T12:27:11Z")
Hello,
I have a vtk data file, with several number of cellIDs (in this case 18 different IDs) is there any way to automatically do a discrete color scheme (that has no transition between different values of IDs, such as blot for example) but that it adapts to the number of IDs? as:
a. I dont know how many I will have for a specific file
b. there can be more IDs than KAAMS scheme (which it looks like to be the one with more colors)
here is a simple example of a vtk file to treat:
[vtkForPropagationGroups.vtk](https://discourse.paraview.org/uploads/short-url/vFQM85xplRgUnXykVraqkQZeQfH.vtk) (18.1 KB)
thanks in advance.
---
### Author:  [@mwestphal](https://discourse.paraview.org/u/mwestphal)
#### Post date: [January 14, 2025, 8:59am UTC](https://discourse.paraview.org/t/discrete-color-scheme-for-vtk-data/15973/2 "2025-01-14T08:59:09Z")
There is no way to “generate” colors for a arbitrary number of values.
What you can is:
1. Use the biggest categorical colormap (BlueObelisk without annotations), this gives you 30 different colors
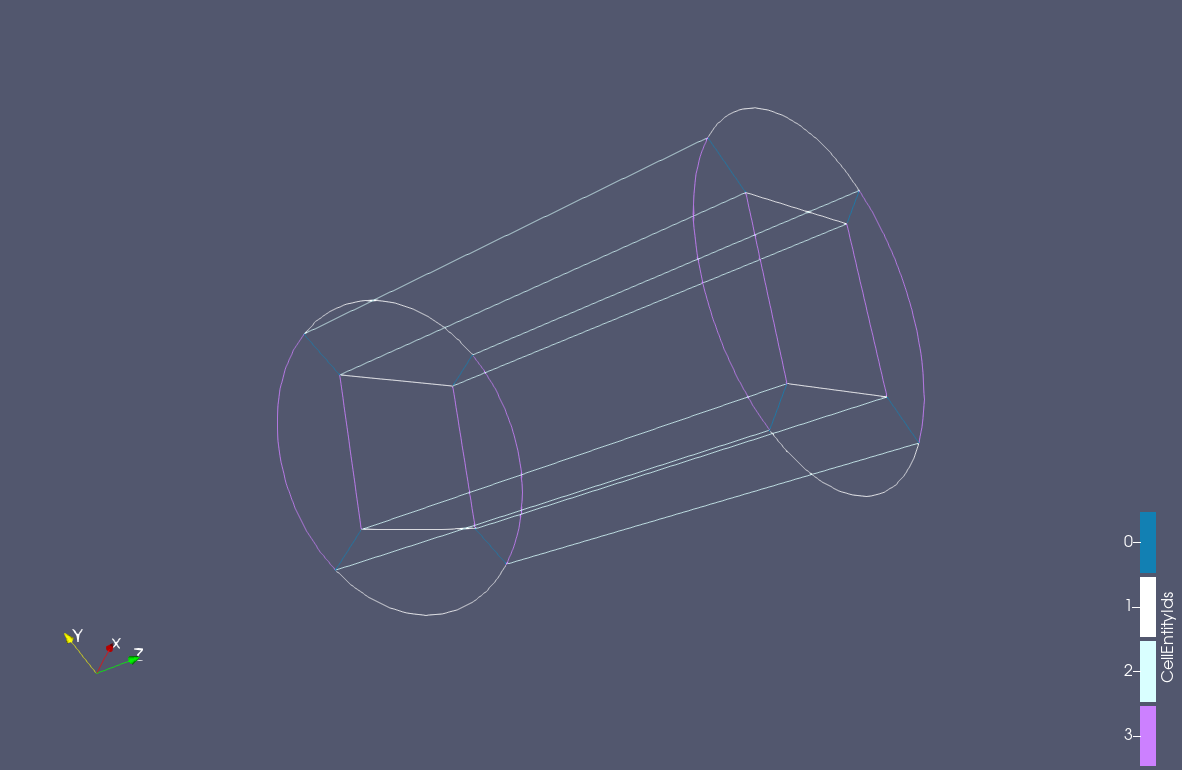
1. Use a linear colormap in step mode
2. Create your own color maps with hundreds of colors for categorical coloring
---
### Author:  [@otaolafr](https://discourse.paraview.org/u/otaolafr)
#### Post date: [January 14, 2025, 12:42pm UTC](https://discourse.paraview.org/t/discrete-color-scheme-for-vtk-data/15973/3 "2025-01-14T12:42:56Z")
Hello mathieu,
I just went a different way that will be more usefull in the end (not exactly what I was asking on my original post for sure, but maybe functional for someone that finds this post).
```auto
def createDisplayOfPropagationGroups(vtkReaderFilter=[]):
if vtkReaderFilter==[]:
vtkReaderFilter= GetActiveSource()
renderView = GetActiveView()
data=dsa.WrapDataObject(servermanager.Fetch(vtkReaderFilter))
N=len(set(data.CellData['CellEntityIds']))
thresholds=[]
threshold1Displays=[]
for i in range(N):
thresholds.append(Threshold(registrationName='Propagation group '+str(i), Input=vtkReaderFilter, Scalars = ['CELLS', 'CellEntityIds'],LowerThreshold = i-0.01, UpperThreshold=i+0.01))
threshold1Displays.append(Show(thresholds[-1], renderView, 'UnstructuredGridRepresentation'))
threshold1Displays[-1].LineWidth = 3.0
threshold1Displays[-1].Representation = 'Surface'
threshold1Displays[-1].SetScalarBarVisibility(renderView, True)
thresholds[-1].UpdatePipeline()
Hide(vtkReaderFilter, renderView)
renderView.Update()
return
```
the only issue I am having right now is that eventhought I am creating the displays objects (with the Show() function) the object are created and everything but they are not shown in the layout view.