# Displays a 3D visualization from a cube grid to a spherical grid
**URL:** https://discourse.paraview.org/t/displays-a-3d-visualization-from-a-cube-grid-to-a-spherical-grid/11094
**Category:** ParaView Support
**Tags:** vtk
**Created:** [January 1, 2023, 4:32pm UTC](https://discourse.paraview.org/t/displays-a-3d-visualization-from-a-cube-grid-to-a-spherical-grid/11094 "2023-01-01T16:32:35Z")
**Posts on this page:** 2
**Page:** 1
### Author:  [@rafifdwi](https://discourse.paraview.org/u/rafifdwi)
#### Post date: [January 1, 2023, 4:32pm UTC](https://discourse.paraview.org/t/displays-a-3d-visualization-from-a-cube-grid-to-a-spherical-grid/11094/1 "2023-01-01T16:32:35Z")
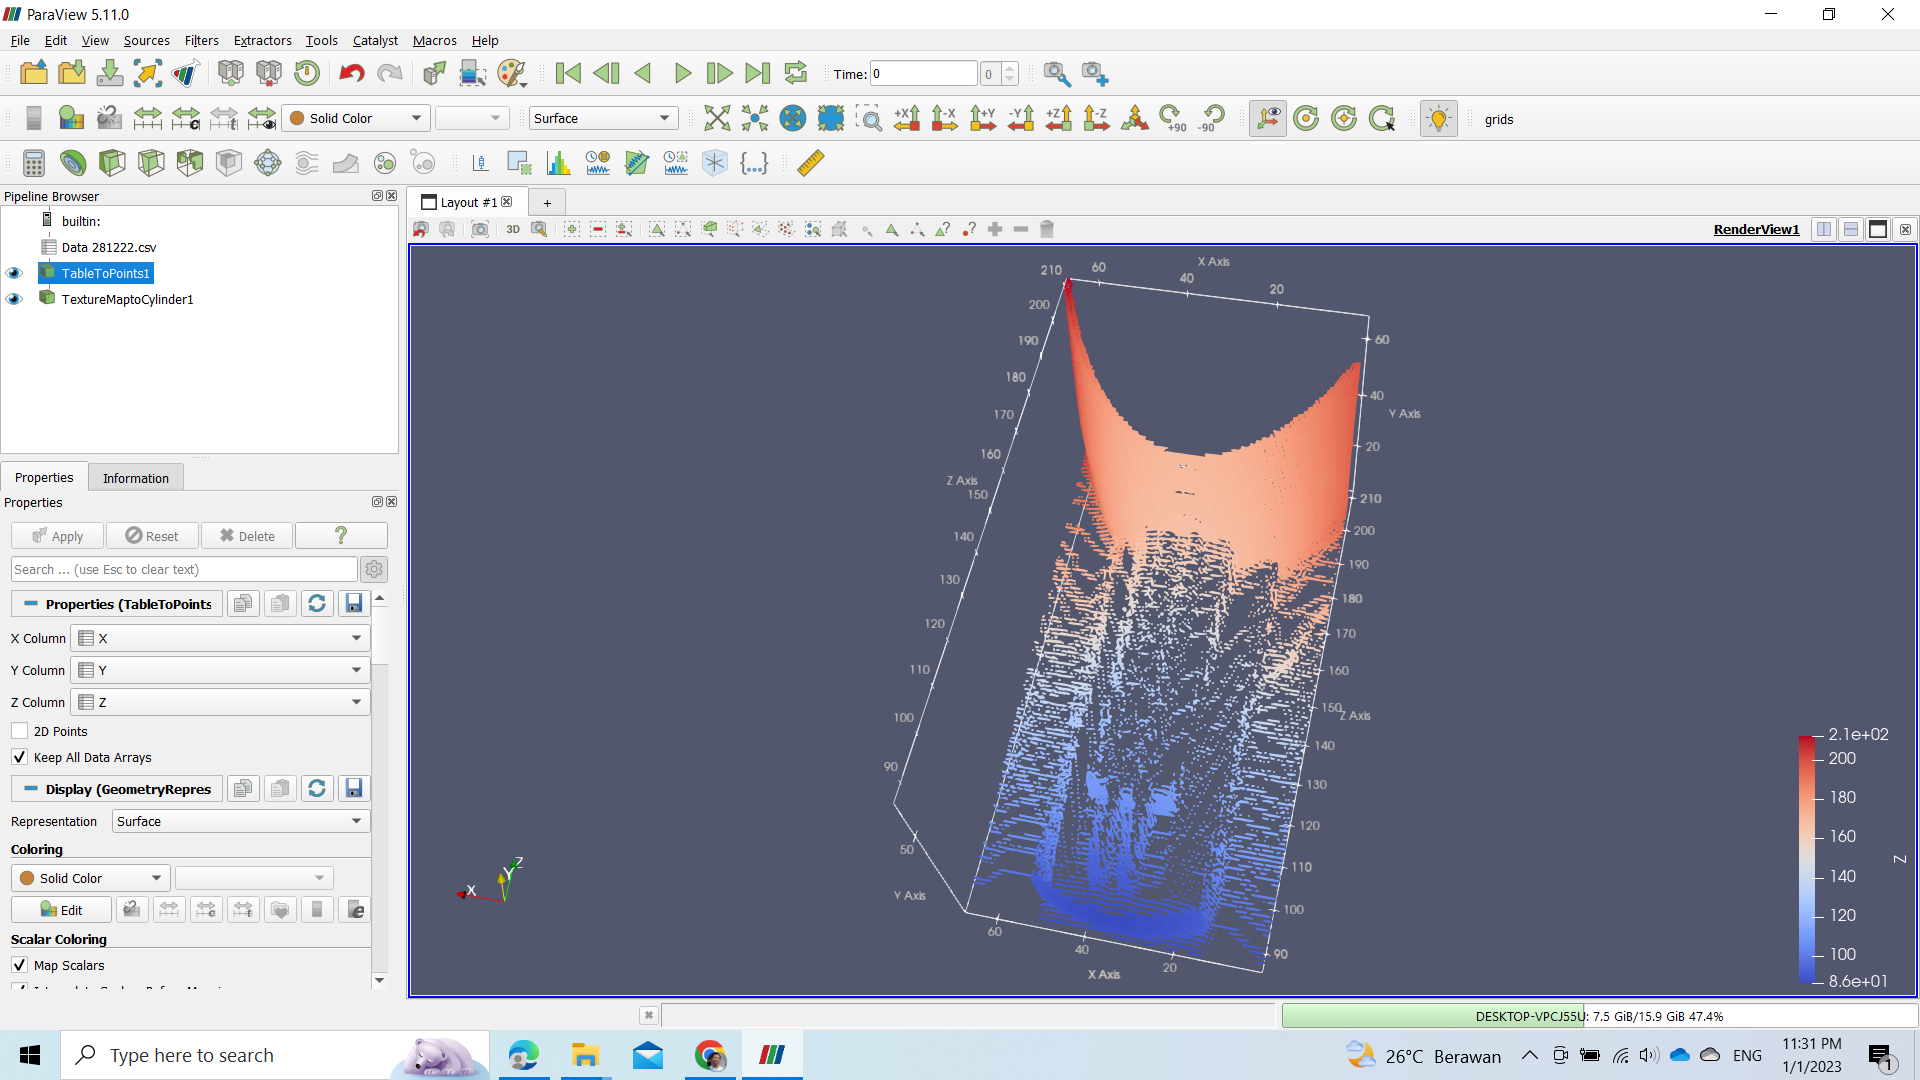
hi, I want to visualize the results of my data which has an X, Y, Z axes with a sphere shape visualization. So, when I display my data with filters “Table to Point” (and I actived the column “keep all data array”) it can only display 3D in the form of a grid of cubes but I want a view that is in the form of 3D with a grid of spheres. so, what should i do to display 3D visuals with a spherical grid (not a cube grid anymore) ? (I really don’t understand using this paraview software)
The following is an image which is the result of my 3D visualization in the form of a cube grid after using the “Table to Point” filter (and I activated the column “keep all data array”)
Thank You !!!
---
### Author:  [@MarkR](https://discourse.paraview.org/u/MarkR)
#### Post date: [January 6, 2023, 4:25pm UTC](https://discourse.paraview.org/t/displays-a-3d-visualization-from-a-cube-grid-to-a-spherical-grid/11094/2 "2023-01-06T16:25:12Z")
Hello,
first off I do not really know the answer to your problem. It intrigued me because researchers local to me do geotechnical seismic work and your question looked like that sort of data. I think it must be _your_ responsibility to transform the data into a spherical coordinate system because paraview (if it were possible) might only provide points equally spaced and not truly representing the spatial variation of your data. How can it know the metrics for converting from computational rectilinear to spherical coords?
I did google this for you though…
> [@Converting Rectilinear Grid data type with spherical coordinates into Spherical representation](https://discourse.paraview.org/t/converting-rectilinear-grid-data-type-with-spherical-coordinates-into-spherical-representation/4442):
>
> I am a new ParaView user and would like to understand how to get ParaView to represent the data file I am using in a spherical format. The background is as follows: I initially received a .FITS file containing data on the Sun’s magnetic field. A friend helped me to convert this into a .vtr file so I could view it using ParaView. The .vtr file I have is of type “Rectilinear Grid” and represents its coordinates as X, Y, Z, where each point/cell stores a magnetic field vector which represents the X…
best wishes and happy new year.
Mark