# Dynamic Time-Dependent Plots in ParaView with DualSPHysics-Moordyn+ Simulations
**URL:** https://discourse.paraview.org/t/dynamic-time-dependent-plots-in-paraview-with-dualsphysics-moordyn-simulations/15206
**Category:** ParaView Support
**Created:** [August 11, 2024, 11:57am UTC](https://discourse.paraview.org/t/dynamic-time-dependent-plots-in-paraview-with-dualsphysics-moordyn-simulations/15206 "2024-08-11T11:57:40Z")
**Posts on this page:** 4
**Page:** 1
### Author:  [@Lorenzo\_De\_Carlo](https://discourse.paraview.org/u/Lorenzo_De_Carlo)
#### Post date: [August 11, 2024, 11:57am UTC](https://discourse.paraview.org/t/dynamic-time-dependent-plots-in-paraview-with-dualsphysics-moordyn-simulations/15206/1 "2024-08-11T11:57:40Z")
Hi everyone,
I’m currently working on simulations using DualSPHysics-Moordyn+ and I’m trying to generate time-dependent plots that dynamically update with the ongoing animation, similar to what’s shown in this video: [https://www.youtube.com/watch?v=Jnf9EGuHiV0](https://www.youtube.com/watch?v=Jnf9EGuHiV0).
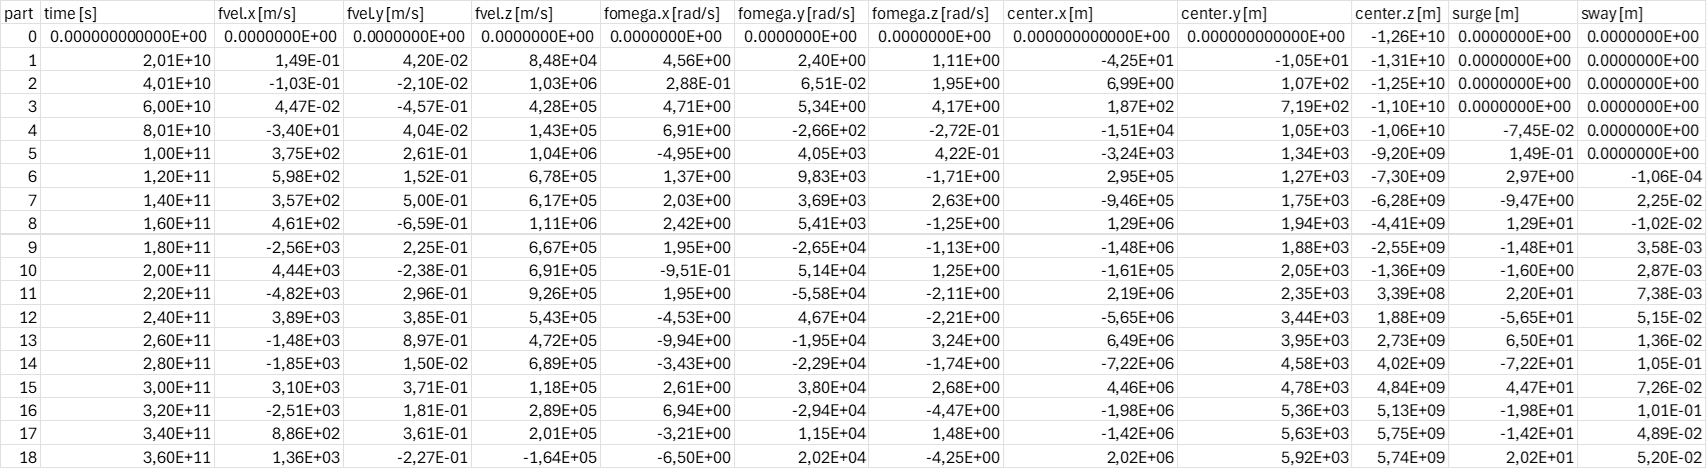
I’m importing a .CSV file containing time-varying data (attached below). When I import the file into ParaView, set the delimiter to “;”, and use the “Plot Data” option, everything works smoothly, and the data is displayed correctly. However, when I try to use “Plot Data Over Time”, I encounter several errors and the plot does not display as expected.
Has anyone had experience with creating time-varying plots in ParaView and could offer some advice on how to resolve this issue? Are there specific steps or settings that I should be checking?
Thanks in advance for any help!
I’ve attached an example of the .CSV file I’m using.
---
### Author:  [@Kenneth\_Moreland](https://discourse.paraview.org/u/Kenneth_Moreland)
#### Post date: [August 11, 2024, 4:54pm UTC](https://discourse.paraview.org/t/dynamic-time-dependent-plots-in-paraview-with-dualsphysics-moordyn-simulations/15206/2 "2024-08-11T16:54:53Z")
The `Plot Data Over Time` filter is the wrong thing to use here. This filter is for data that changes over time (so when you hit the play  button, the data changes). It would be for a sequence of csv files where each file represents a different timestep.
Using `Plot Data` is correct. However, for ParaView to understand that this is a plot over time (and thus add the time marker), the X axis of the plot has to be a field named exactly `Time` (with a capitol `T`). However, your time column is named `time [s]`.
To fix the problem, _before_ you add the `Plot Data` filter, add the `RenameArrays` filter, and rename `time [s]` to `Time`. Then add the `Plot Data` filter.
In the properties panel, _uncheck_ the `Use Index For X Axis` and set `X Array Name` to the `Time` array. At this point, the time marker should show up.
---
### Author:  [@mwestphal](https://discourse.paraview.org/u/mwestphal)
#### Post date: [August 12, 2024, 11:31am UTC](https://discourse.paraview.org/t/dynamic-time-dependent-plots-in-paraview-with-dualsphysics-moordyn-simulations/15206/3 "2024-08-12T11:31:31Z")
Sounds like quite a limitation, it would be nice to make this behavior controllable, wdyt ?
---
### Author:  [@Lorenzo\_De\_Carlo](https://discourse.paraview.org/u/Lorenzo_De_Carlo)
#### Post date: [August 13, 2024, 1:13am UTC](https://discourse.paraview.org/t/dynamic-time-dependent-plots-in-paraview-with-dualsphysics-moordyn-simulations/15206/4 "2024-08-13T01:13:14Z")
Thank you very much for the suggestion. I followed the procedure you recommended: I renamed the `time [s]` column to `Time` using the `RenameArrays` filter and then applied the `Plot Data` filter. I was indeed able to make the time marker appear, but I’ve encountered a couple of issues.
When I press the _Play_ button, the time marker moves along the X-axis, but the plot doesn’t update dynamically with the time. It seems that the marker is just moving along the current plot without refreshing the displayed data. Additionally, I noticed that the marker gets stuck at 1 second, even though the .csv file I’m importing data from contains values up to 10 seconds.
Could you help me understand what I might be doing wrong? If necessary, I can attach the .csv file to provide more details and facilitate targeted advice.
Thank you again for your assistance!
[FloatingMotion\_mk60.csv](https://discourse.paraview.org/uploads/short-url/n2dEDqsm9J7PcwOFpPLD3ZsfenP.csv) (184.7 KB)