# Error while plotting Streamline in 3D Plot
**URL:** https://discourse.paraview.org/t/error-while-plotting-streamline-in-3d-plot/13639
**Category:** ParaView Support
**Tags:** python
**Created:** [January 6, 2024, 6:39am UTC](https://discourse.paraview.org/t/error-while-plotting-streamline-in-3d-plot/13639 "2024-01-06T06:39:37Z")
**Posts on this page:** 10
**Page:** 1
### Author:  [@SKSoni](https://discourse.paraview.org/u/SKSoni)
#### Post date: [January 6, 2024, 6:39am UTC](https://discourse.paraview.org/t/error-while-plotting-streamline-in-3d-plot/13639/1 "2024-01-06T06:39:37Z")
# Dear All, I want to plot streamline from 3d CSV Data that includes columns as [x, y, z, u1, u2, u3, T]. where,
# x, y, z - —\> 3d co-ordinates u1, u2, u3 --------\> velocity components along x, y, and z dirn resp. T → temperature value at (x, y, z) coordinate
I want to generate streamline using this CSV data. For this, I have followed steps as:
1. upload data
2. Applied filter convert data in TabletoPoint
3. Applied filter Delanau 3d
4. Applied filter Calculator for computing Steamline equation and the equation is
streamline = [Vx \* iHat+ Vy \* jHat+ Vz \* kHat]
but, it is showing an error as “Undefined symbol Vx”.
Kindly help me to fix it.
CSV data is
[data.csv](https://discourse.paraview.org/uploads/short-url/iyGKn1lDY49w3P1uhbHuOTUiR46.csv) (332.6 KB)
---
### Author:  [@nicolas.vuaille](https://discourse.paraview.org/u/nicolas.vuaille)
#### Post date: [January 10, 2024, 9:12am UTC](https://discourse.paraview.org/t/error-while-plotting-streamline-in-3d-plot/13639/2 "2024-01-10T09:12:44Z")
Hi,
There is no `Vx` data array in your file. Do you mean `u1` ?
---
### Author:  [@SKSoni](https://discourse.paraview.org/u/SKSoni)
#### Post date: [January 10, 2024, 3:02pm UTC](https://discourse.paraview.org/t/error-while-plotting-streamline-in-3d-plot/13639/3 "2024-01-10T15:02:03Z")
Yes @nicolas.vuaille
Here, Vx -----\> u1, Vy----\> u2, Vz------\>u3
Also, please suggest the steps for generating the streamlines and Velocity vector.
Thanks for acknowledging the topic.
---
### Author:  [@nicolas.vuaille](https://discourse.paraview.org/u/nicolas.vuaille)
#### Post date: [January 10, 2024, 3:13pm UTC](https://discourse.paraview.org/t/error-while-plotting-streamline-in-3d-plot/13639/4 "2024-01-10T15:13:49Z")
Hi,
you can merge velocity components into one array using `Merge Vector Components`.
you can try the `Streamlines` filter, that creates streamlines (from some generated seeds)
---
### Author:  [@SKSoni](https://discourse.paraview.org/u/SKSoni)
#### Post date: [January 11, 2024, 7:55am UTC](https://discourse.paraview.org/t/error-while-plotting-streamline-in-3d-plot/13639/5 "2024-01-11T07:55:38Z")
Hello @nicolas.vuaille
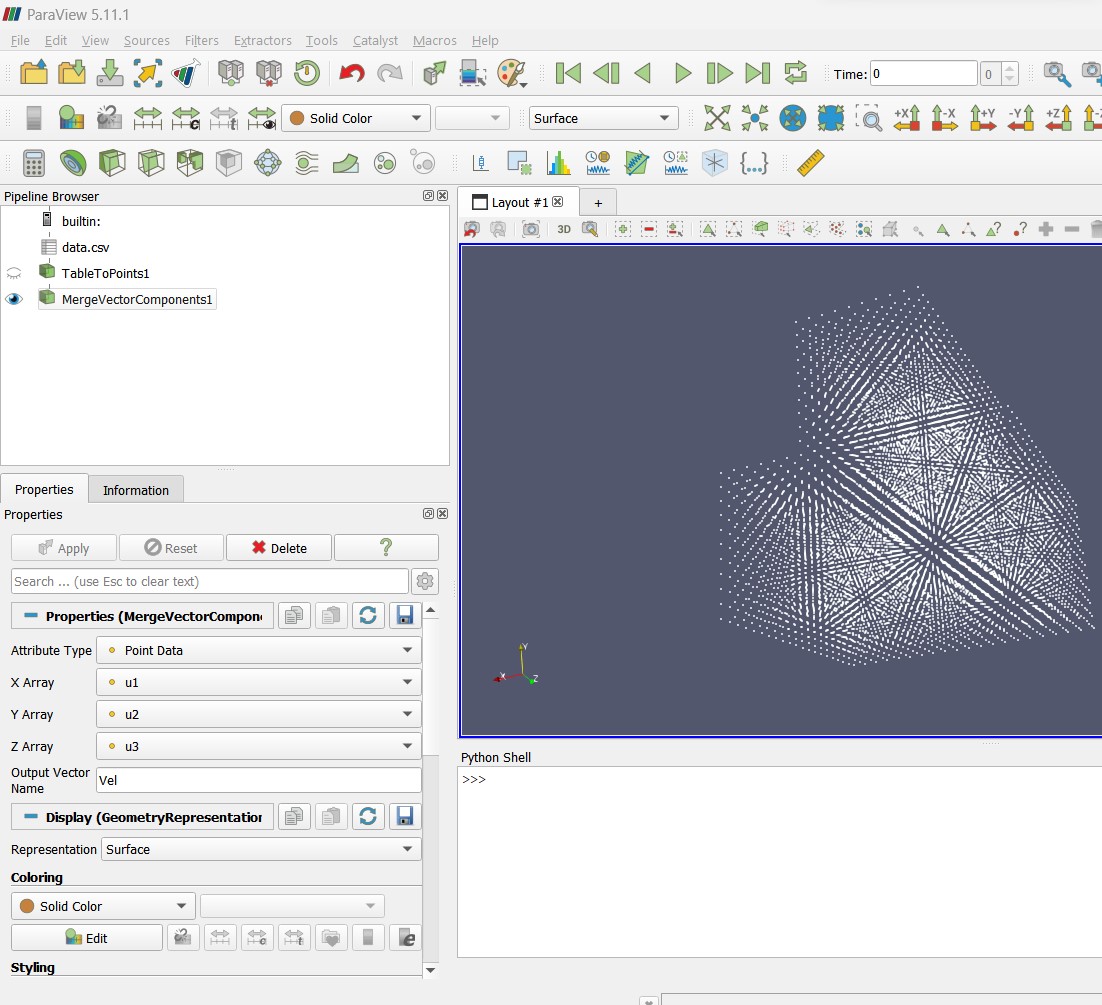
I have followed the steps
But as I am applying the streamtracer option on Velocity vector, the Paraview gets closed completely.
can you comment on it?
Also, I have attached the snapshot for your reference, please comment on the steps.
---
### Author:  [@nicolas.vuaille](https://discourse.paraview.org/u/nicolas.vuaille)
#### Post date: [January 11, 2024, 8:23am UTC](https://discourse.paraview.org/t/error-while-plotting-streamline-in-3d-plot/13639/6 "2024-01-11T08:23:47Z")
Ugh, indeed, there is an issue here …
_edit_
Streamtracer expects a connectivity between points, so it wont work on point cloud. A solution is to add a `Delaunay 3D` after the `Table To Points`.
_edit2_
an issue is already open about the crash: [https://gitlab.kitware.com/paraview/paraview/-/issues/13249](https://gitlab.kitware.com/paraview/paraview/-/issues/13249)
---
### Author:  [@SKSoni](https://discourse.paraview.org/u/SKSoni)
#### Post date: [January 11, 2024, 3:45pm UTC](https://discourse.paraview.org/t/error-while-plotting-streamline-in-3d-plot/13639/7 "2024-01-11T15:45:26Z")
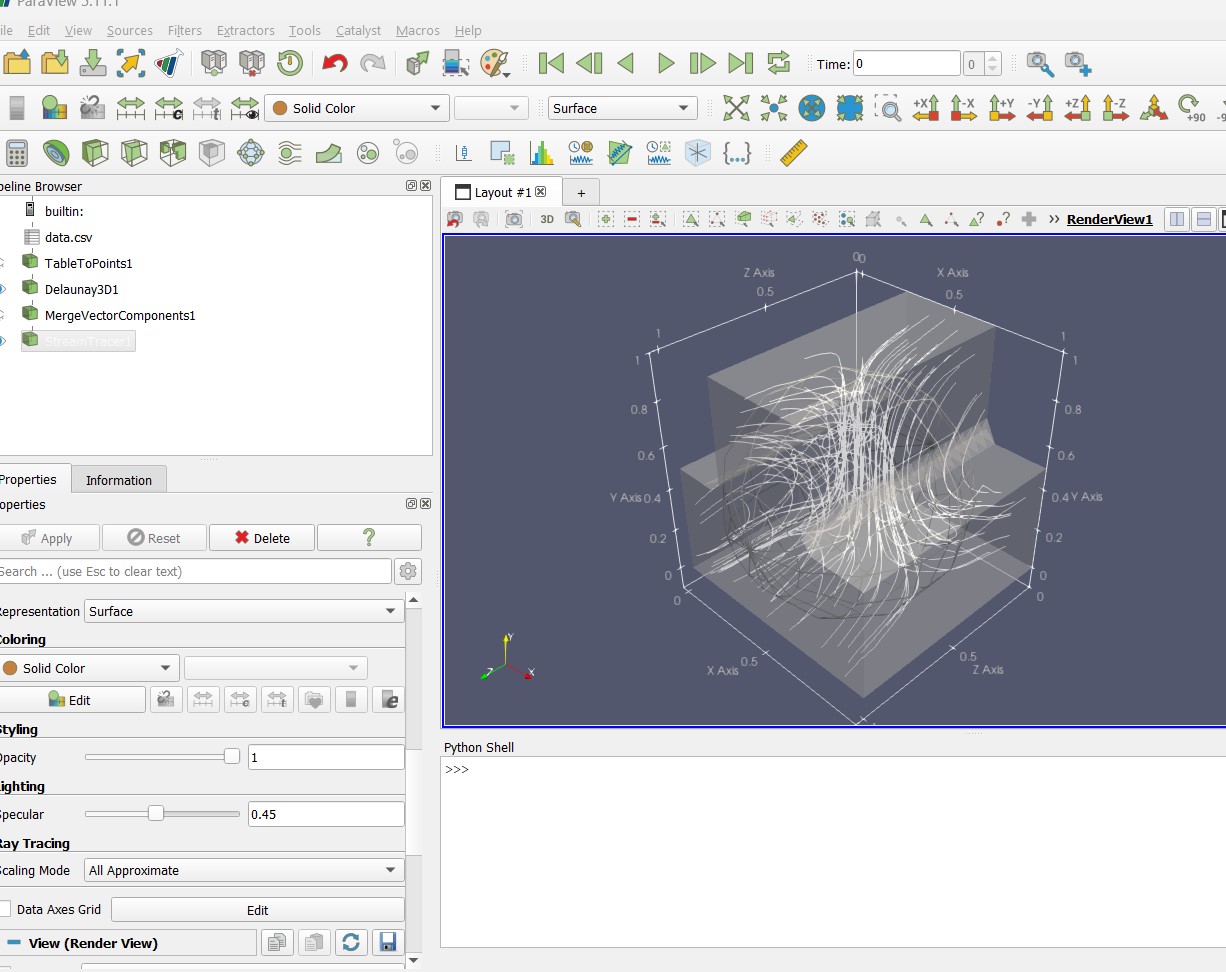
Now it works correctly for me.
May I ask one more doubt for
a) Domain includes a hollow cylinder having a center (0.5, 0.5, Z) and Z varies from 0 to 1.
Can we plot results for such a domain using CSV data?
---
### Author:  [@nicolas.vuaille](https://discourse.paraview.org/u/nicolas.vuaille)
#### Post date: [January 12, 2024, 9:13am UTC](https://discourse.paraview.org/t/error-while-plotting-streamline-in-3d-plot/13639/8 "2024-01-12T09:13:50Z")
> [@SKSoni](#):
>
> Now it works correctly for me.
Nice!
> [@SKSoni](#):
>
> Can we plot results for such a domain
I’m not sure to understand what you want to do:
- `plot`: which kind of view do you expect? in paraview `plot` means `line chart`
- `results`: which data ? The vector field ? The streamlines ?
Also, feel free to create a new post if needed
---
### Author:  [@SKSoni](https://discourse.paraview.org/u/SKSoni)
#### Post date: [January 12, 2024, 8:05pm UTC](https://discourse.paraview.org/t/error-while-plotting-streamline-in-3d-plot/13639/9 "2024-01-12T20:05:50Z")
Thanks @nicolas.vuaille Sir for your quick response.
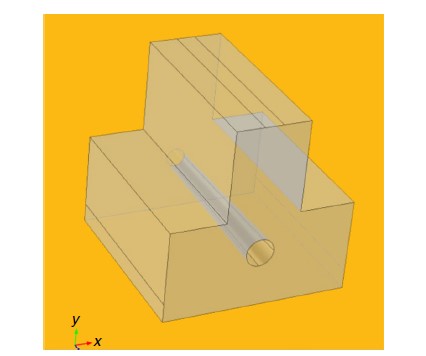
Firstly, I am trying to generate the 3d domain (attached fig) with CSV data, where a circular cylinder is placed at the center.
Mainly to avoid the 3d triangulation to the inner cylinder and then other result plots (streamlines mainly).
---
### Author:  [@nicolas.vuaille](https://discourse.paraview.org/u/nicolas.vuaille)
#### Post date: [January 15, 2024, 9:47am UTC](https://discourse.paraview.org/t/error-while-plotting-streamline-in-3d-plot/13639/10 "2024-01-15T09:47:58Z")
Creating meshes (including surfaces) from point cloud is not so easy task.
I fear you need `Delaunay`. Then you may `Extract surface` if you do not want inner triangles, and you can `Clip` with a cylinder to remove the inner cylinder.
Also, if you have more issues with this part, a new post may be more appropriate: I’m not expert on meshing and people who does will not be catched by this post 🙂