# Exporting python polar plot into VTK
**URL:** https://discourse.paraview.org/t/exporting-python-polar-plot-into-vtk/13767
**Category:** ParaView Support
**Created:** [January 22, 2024, 2:19pm UTC](https://discourse.paraview.org/t/exporting-python-polar-plot-into-vtk/13767 "2024-01-22T14:19:07Z")
**Posts on this page:** 4
**Page:** 1
### Author:  [@sangjun11316](https://discourse.paraview.org/u/sangjun11316)
#### Post date: [January 22, 2024, 2:19pm UTC](https://discourse.paraview.org/t/exporting-python-polar-plot-into-vtk/13767/1 "2024-01-22T14:19:07Z")
I have python numpy arrays of radius, theta, and values that will generate the following image
(radius: 1d, theta: 1d, values: 2d [dim\_theta, dim\_radius])
```auto
fig, ax = plt.subplots(subplot_kw=dict(projection='polar'))
meshRadius, meshTheta = np.meshgrid(radius, theta)
ax.contourf(meshTheta, meshRadius, values)
```
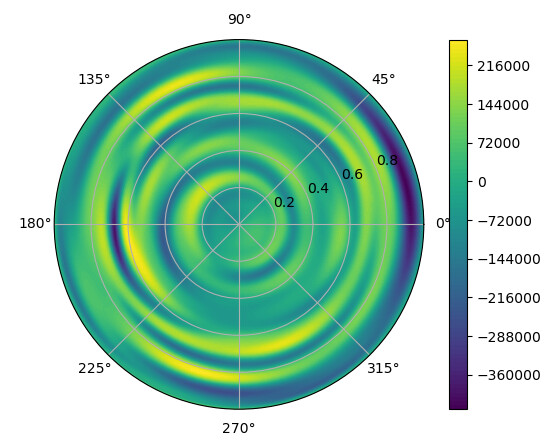
I tried to export this into VTK with the following
```auto
import vtk
from vtk.util import numpy_support
npts = np.shape(values)
Points = vtk.vtkPoints()
Vertices = vtk.vtkCellArray()
values_vtk = []
for i_radius in range(npts[1]):
_r = radius[i_radius]
for i_theta in range(npts[0]):
_theta = theta[i_theta]
_id = Points.InsertNextPoint(_r*np.cos(_theta), _r*np.sin(_theta), 0.)
Vertices.InsertNextCell(1)
Vertices.InsertCellPoint(_id)
values_vtk.append(values[i_theta,i_radius])
values_vtk = np.array(values_vtk)
polyData = vtk.vtkPolyData()
polyData.SetPoints(Points)
polyData.SetVerts(Vertices)
pointData = polyData.GetPointData()
values_vtk2 = numpy_support.numpy_to_vtk(values_vtk)
values_vtk2.SetName("InvDFT")
pointData.AddArray(values_vtk2)
writer = vtk.vtkPolyDataWriter()
writer.SetFileName("vtk.vtk")
writer.SetInputData(polyData)
writer.Write()
```
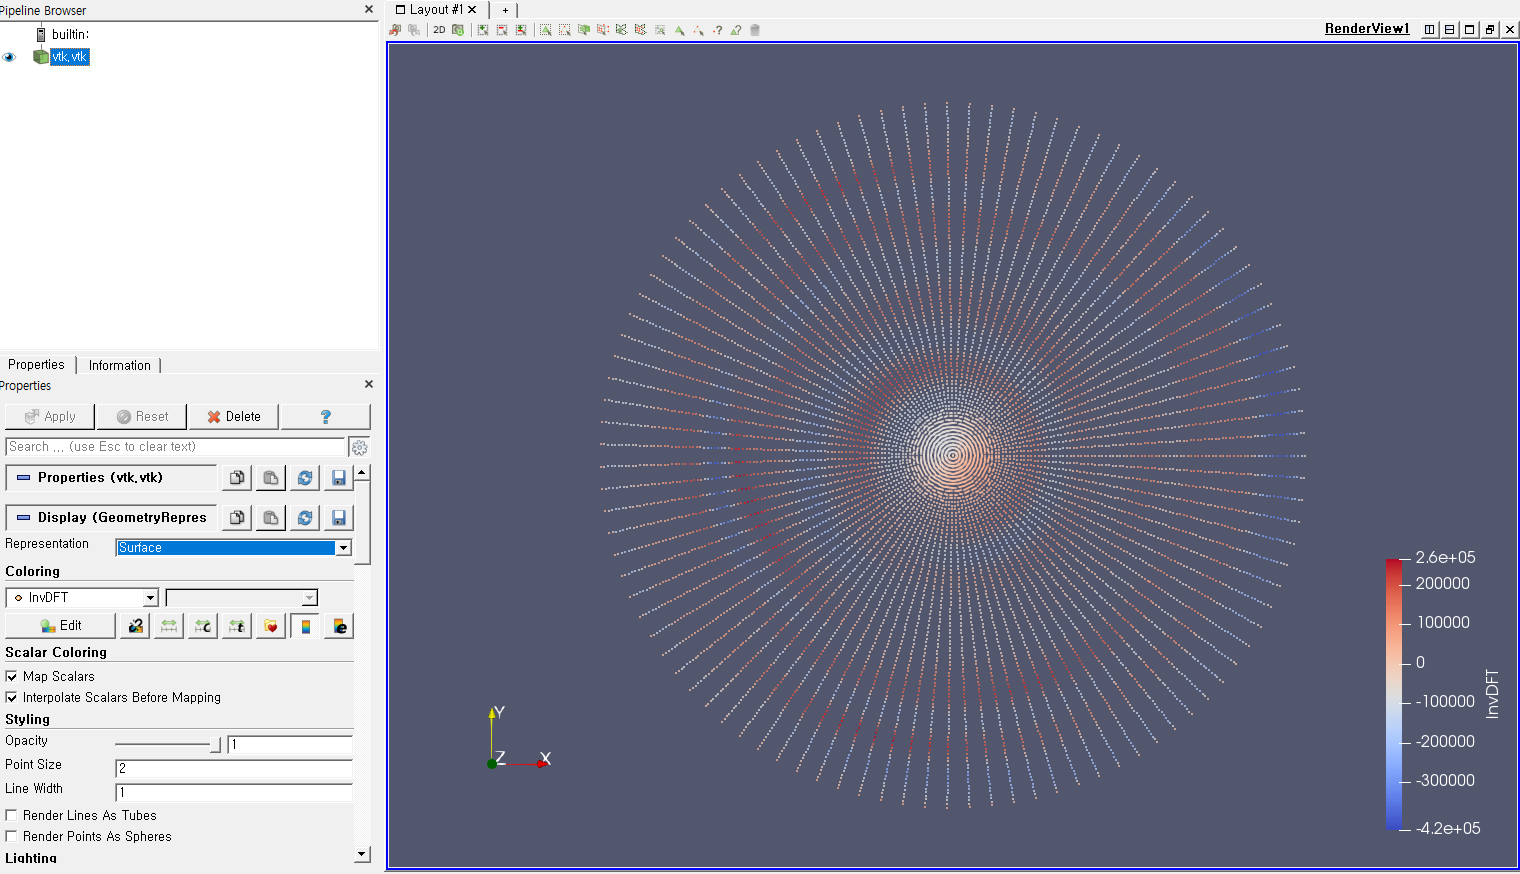
I think I am almost there, but somehow I should specify the connectivities sort of things to make this ‘surface’ plot.
Could anyone help a bit here?
---
### Author:  [@cory.quammen](https://discourse.paraview.org/u/cory.quammen)
#### Post date: [January 22, 2024, 3:09pm UTC](https://discourse.paraview.org/t/exporting-python-polar-plot-into-vtk/13767/2 "2024-01-22T15:09:02Z")
This is more of a VTK question, but we can follow up here.
> [@sangjun11316](#):
>
> I think I am almost there, but somehow I should specify the connectivities sort of things ot make this ‘surface’ plot.
That’s correct. You have inserted 0-dimensional (no connectivity) cells, one for each point. Instead, you will need to insert a 2-dimensional cell, such as quads or triangles, to produce a mesh like you produce with your call to `np.meshgrid`.
There isn’t a convenient call like that in VTK. Instead, I recommend figuring our the connectivity among neighboring points and setting up cells with those point IDs manually. You’ll probably want to insert the points first in a loop and the insert the cells in a later loop. You don’t need to know the point positions to define the cells, just the point IDs and how they are arranged in space to determine the polygon you want to insert (an exercise left to the poster).
---
### Author:  [@sangjun11316](https://discourse.paraview.org/u/sangjun11316)
#### Post date: [January 23, 2024, 3:32am UTC](https://discourse.paraview.org/t/exporting-python-polar-plot-into-vtk/13767/3 "2024-01-23T03:32:40Z")
Thanks to the comments from @cory.quammen , I get it to work.
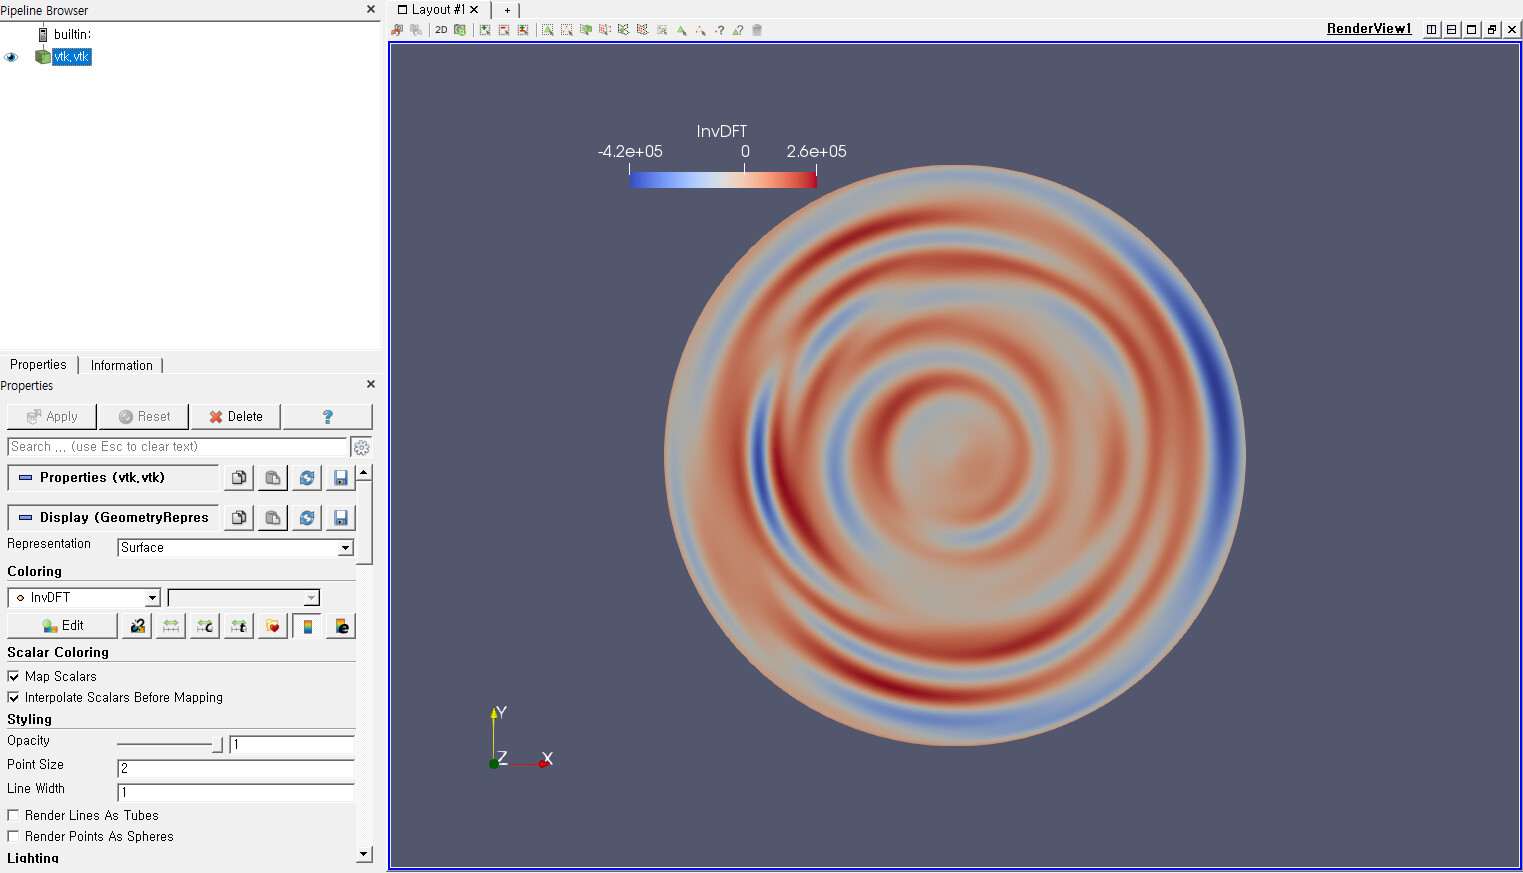
The point hindered me the most was that my wrong usage of ‘SetVerts’ instead of ‘SetPolys’, which is commented in the following modified version of the Python script.
```auto
import vtk
from vtk.util import numpy_support
npts = np.shape(values)
Points = vtk.vtkPoints()
Vertices = vtk.vtkCellArray()
values_vtk = []
# Modification 1) Now I am storing ids array to make connectivity construction easier
ids = np.zeros((npts[1],npts[0]))
for i_radius in range(npts[1]):
_r = radius[i_radius]
for i_theta in range(npts[0]):
_theta = theta[i_theta]
_id = Points.InsertNextPoint(_r*np.cos(_theta), _r*np.sin(_theta), 0.)
ids[i_theta,i_radius] = _id
values_vtk.append(values[i_theta,i_radius])
values_vtk = np.array(values_vtk)
# Modification 2) Separating the connectivity loop
for i_radius in range(npts[1]-1): # Note: be aware of '-1' following npts[0]
for i_theta in range(npts[0]-1): # Note: be aware of '-1' following npts[0]
# Modification 3) Now I am using '4' instead of '1' for InsertNextCell
Vertices.InsertNextCell(4)
Vertices.InsertCellPoint(int(ids[i_theta,i_radius]))
Vertices.InsertCellPoint(int(ids[i_theta,i_radius+1]))
Vertices.InsertCellPoint(int(ids[i_theta+1,i_radius+1]))
Vertices.InsertCellPoint(int(ids[i_theta+1,i_radius]))
polyData = vtk.vtkPolyData()
polyData.SetPoints(Points)
# Modiciation 4) SetVerts have been replaced by SetPolys
#polyData.SetVerts(Vertices)
polyData.SetPolys(Vertices)
pointData = polyData.GetPointData()
values_vtk2 = numpy_support.numpy_to_vtk(values_vtk)
values_vtk2.SetName("InvDFT")
pointData.AddArray(values_vtk2)
writer = vtk.vtkPolyDataWriter()
writer.SetFileName("vtk.vtk")
writer.SetInputData(polyData)
writer.Write()
```
---
### Author:  [@cory.quammen](https://discourse.paraview.org/u/cory.quammen)
#### Post date: [January 23, 2024, 2:31pm UTC](https://discourse.paraview.org/t/exporting-python-polar-plot-into-vtk/13767/4 "2024-01-23T14:31:46Z")
Awesome! Nice job!