# Extracting stream-wise (U\_x) and span-wise(U\_y) velocities from a specified sub-domain
**URL:** https://discourse.paraview.org/t/extracting-stream-wise-u-x-and-span-wise-u-y-velocities-from-a-specified-sub-domain/13772
**Category:** ParaView Support
**Tags:** python, vtk
**Created:** [January 22, 2024, 5:25pm UTC](https://discourse.paraview.org/t/extracting-stream-wise-u-x-and-span-wise-u-y-velocities-from-a-specified-sub-domain/13772 "2024-01-22T17:25:54Z")
**Posts on this page:** 13
**Page:** 1
### Author:  [@Nafiz375](https://discourse.paraview.org/u/Nafiz375)
#### Post date: [January 22, 2024, 5:25pm UTC](https://discourse.paraview.org/t/extracting-stream-wise-u-x-and-span-wise-u-y-velocities-from-a-specified-sub-domain/13772/1 "2024-01-22T17:25:55Z")
Hello everyone,
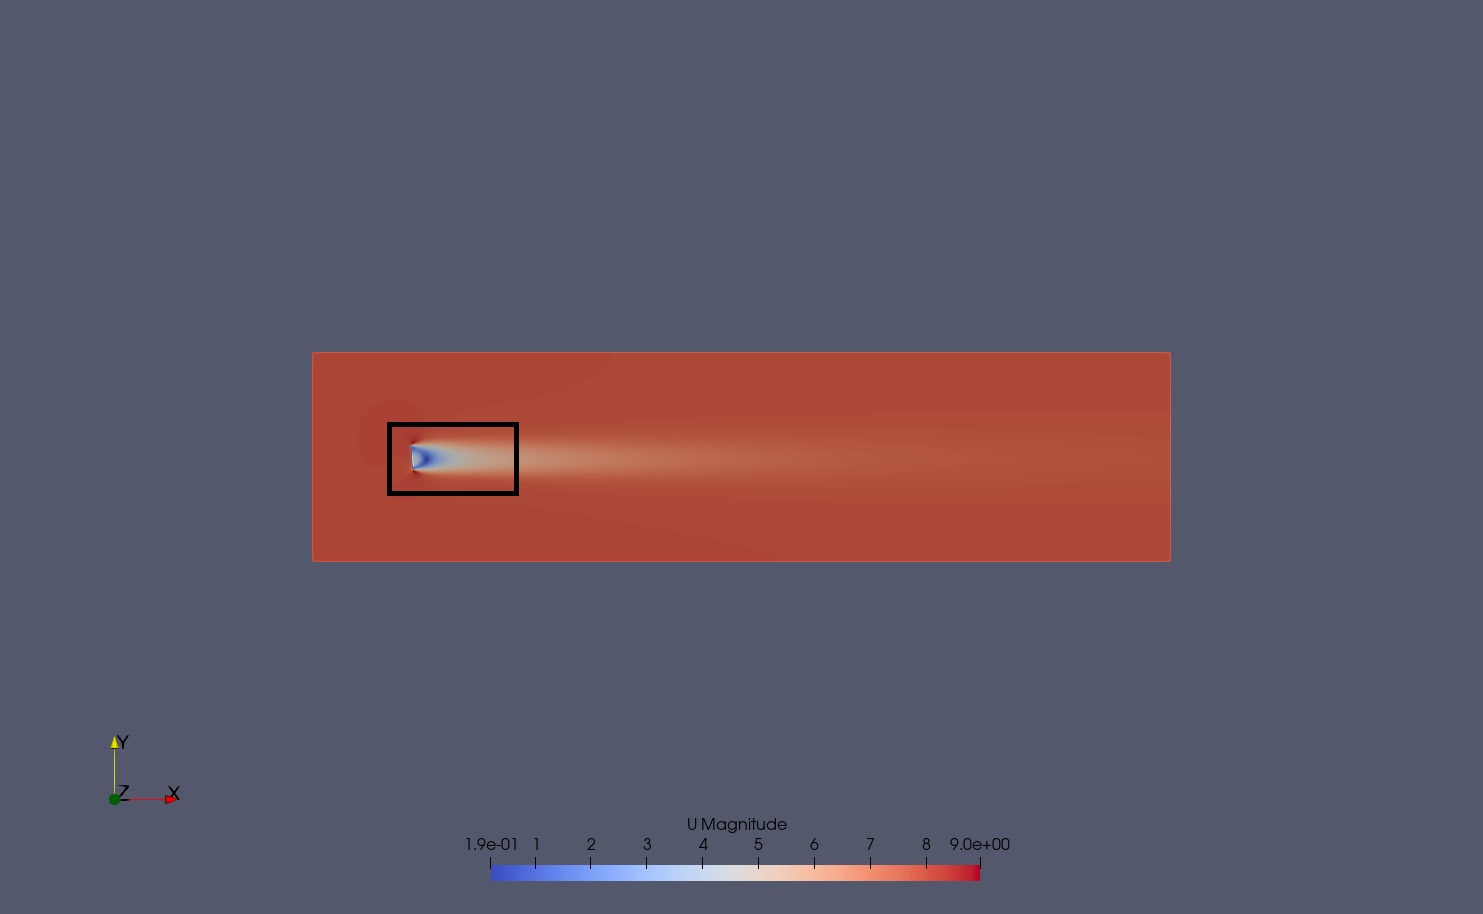
I’ve done 3D actuator disk simulation in OpenFoam, and now I’m trying to extract some data. I need to get the velocity components in a particular subdomain, not in the full domain. The attached figure is for reference. Moreover, I know there will be thousands of points in the particular subdomain I mentioned, but I just need to find velocities at only 64 uniformly distributed points.
**Question 1:** How can I do that?
**Question 2:**
I have the VTK files for each of my simulations. Is there any way that I can convert my VTK files to a nummpy array and get the data for a particular plane and for a subdomain?
---
### Author:  [@Nafiz375](https://discourse.paraview.org/u/Nafiz375)
#### Post date: [January 25, 2024, 12:21am UTC](https://discourse.paraview.org/t/extracting-stream-wise-u-x-and-span-wise-u-y-velocities-from-a-specified-sub-domain/13772/2 "2024-01-25T00:21:50Z")
Anyone have some suggestions?
---
### Author:  [@mwestphal](https://discourse.paraview.org/u/mwestphal)
#### Post date: [January 25, 2024, 8:44am UTC](https://discourse.paraview.org/t/extracting-stream-wise-u-x-and-span-wise-u-y-velocities-from-a-specified-sub-domain/13772/3 "2024-01-25T08:44:20Z")
> [@Nafiz375](#):
>
> I need to get the velocity components in a particular subdomain, not in the full domain.
Use Clip filter or Selection filters ?
---
### Author:  [@Nafiz375](https://discourse.paraview.org/u/Nafiz375)
#### Post date: [January 25, 2024, 4:02pm UTC](https://discourse.paraview.org/t/extracting-stream-wise-u-x-and-span-wise-u-y-velocities-from-a-specified-sub-domain/13772/4 "2024-01-25T16:02:52Z")
Hello Mathieu,
I’ve extracted my u and v component velocities for that specified zone. Now, I found something unusual: for the same x-grid point, four (4) y-grid points are shown in my extracted data, and their corresponding u and v velocities are also different. For example, (385.875, 406.98), this point appears four times, and their corresponding U\_x and U\_y velocities are also different. Any comment on this? How can I solve this issue?
---
### Author:  [@mwestphal](https://discourse.paraview.org/u/mwestphal)
#### Post date: [January 25, 2024, 4:31pm UTC](https://discourse.paraview.org/t/extracting-stream-wise-u-x-and-span-wise-u-y-velocities-from-a-specified-sub-domain/13772/5 "2024-01-25T16:31:48Z")
Please share a screenshot ?
---
### Author:  [@Nafiz375](https://discourse.paraview.org/u/Nafiz375)
#### Post date: [January 25, 2024, 7:45pm UTC](https://discourse.paraview.org/t/extracting-stream-wise-u-x-and-span-wise-u-y-velocities-from-a-specified-sub-domain/13772/6 "2024-01-25T19:45:18Z")

This is the screenshot. Sometimes I find that for a particular x-axis value, the y-axis value is repeated 3/4 times. And their U\_x and U\_y values are also different.
---
### Author:  [@mwestphal](https://discourse.paraview.org/u/mwestphal)
#### Post date: [January 26, 2024, 8:04am UTC](https://discourse.paraview.org/t/extracting-stream-wise-u-x-and-span-wise-u-y-velocities-from-a-specified-sub-domain/13772/7 "2024-01-26T08:04:22Z")
I have no idea what I’m seeing here.
You say:
> Now, I found something unusual: for the same x-grid point, four (4) y-grid points are shown in my extracted data, and their corresponding u and v velocities are also different.
To me it means that points got duplicated somehow.
Please share data and exacts steps to reproduce.
---
### Author:  [@Nafiz375](https://discourse.paraview.org/u/Nafiz375)
#### Post date: [January 26, 2024, 1:22pm UTC](https://discourse.paraview.org/t/extracting-stream-wise-u-x-and-span-wise-u-y-velocities-from-a-specified-sub-domain/13772/8 "2024-01-26T13:22:46Z")
I have added my CSV file here.
[Velocity\_data\_8\_ms\_3.57\_deg.csv](https://discourse.paraview.org/uploads/short-url/ncPgkp4W0c9e3gLNVPb9BSLaj1r.csv) (2.6 MB)
The code I have used here is:
```
import vtk
import os
import numpy as np
import pandas as pd
from vtk.util.numpy_support import vtk_to_numpy
def extract_data_within_range(vtk_data, min_range, max_range, axes):
all_velocity_data = np.array([]).reshape(0, 2)
all_axes_values = np.array([]).reshape(0, 2)
for block_id in range(vtk_data.GetNumberOfBlocks()):
block = vtk_data.GetBlock(block_id)
if block.IsA('vtkUnstructuredGrid'):
point_data = block.GetPointData()
if point_data.GetArray('U') is not None:
velocity_data = vtk_to_numpy(point_data.GetArray('U'))
point_coordinates = vtk_to_numpy(block.GetPoints().GetData())
indices = np.all((min_range <= point_coordinates) & (point_coordinates <= max_range), axis=1)
# Extracting velocity data for the selected points
velocity_data = velocity_data[indices, :2] # Excluded U_z values
# Filter out 0 and negative values for U_x
mask = (velocity_data[:, 0] > 0) & (1 <= velocity_data[:, 0]) & (velocity_data[:, 0] <= 8)
velocity_data = velocity_data[mask]
# Extracting corresponding axis values
axis_values = point_coordinates[indices][:, axes][mask]
# Concatenated velocity data and axis values to the global arrays
all_velocity_data = np.vstack([all_velocity_data, velocity_data])
all_axes_values = np.vstack([all_axes_values, axis_values])
return all_velocity_data, all_axes_values
vtk_parent_folder = 'C:/Users/Nafiz375/openfoam_inputs/'
all_velocity_data = np.array([]).reshape(0, 2)
all_axes_values = np.array([]).reshape(0, 2)
for folder_name in os.listdir(vtk_parent_folder):
# Constructing the full path to the current folder
folder_path = os.path.join(vtk_parent_folder, folder_name)
if os.path.isdir(folder_path):
# Initialize empty arrays for the current folder
folder_velocity_data = np.array([]).reshape(0, 2)
folder_axes_values = np.array([]).reshape(0, 2)
# Iterating through all files in the current folder
for root, dirs, files in os.walk(folder_path):
# Filter for .vtm files
vtm_files = [f for f in files if f.endswith('.vtm')]
# Iterating through each .vtm file in the current directory
for vtm_file in vtm_files:
# Construct the full path to the current file
vtm_file_path = os.path.join(root, vtm_file)
# Creating a reader for the VTM file
reader = vtk.vtkXMLMultiBlockDataReader()
reader.SetFileName(vtm_file_path)
# Read the data
reader.Update()
# Get the output data
vtk_data = reader.GetOutput()
if vtk_data is not None:
# Extracting data within the specified range along the x-axis and y-axis
velocity_data, axes_values = extract_data_within_range(vtk_data, np.array([378, 283.5, 535.5]), np.array([1008, 787.5, 535.5]), axes=(0, 1))
# Concatenating velocity data and axis values to the folder arrays
folder_velocity_data = np.vstack([folder_velocity_data, velocity_data])
folder_axes_values = np.vstack([folder_axes_values, axes_values])
# Concatenating folder arrays to the global arrays
all_velocity_data = np.vstack([all_velocity_data, folder_velocity_data])
all_axes_values = np.vstack([all_axes_values, folder_axes_values])
# Converting the folder arrays to a Pandas DataFrame
folder_df = pd.DataFrame(folder_velocity_data, columns=['U_x', 'U_y'])
folder_df['x'] = folder_axes_values[:, 0]
folder_df['y'] = folder_axes_values[:, 1]
# Saving the folder DataFrame to a CSV file
csv_file_path = f'D:/Velocity_data_{folder_name}.csv'
folder_df.to_csv(csv_file_path, index=False)
print(f"Filtered velocity data along x-axis and y-axis for {folder_name} has been saved to {csv_file_path}.")
```
---
### Author:  [@Nafiz375](https://discourse.paraview.org/u/Nafiz375)
#### Post date: [January 29, 2024, 7:25pm UTC](https://discourse.paraview.org/t/extracting-stream-wise-u-x-and-span-wise-u-y-velocities-from-a-specified-sub-domain/13772/9 "2024-01-29T19:25:26Z")
Any recommendations about the problem I am having?
---
### Author:  [@Kenichiro-Yoshimi](https://discourse.paraview.org/u/Kenichiro-Yoshimi)
#### Post date: [January 29, 2024, 10:21pm UTC](https://discourse.paraview.org/t/extracting-stream-wise-u-x-and-span-wise-u-y-velocities-from-a-specified-sub-domain/13772/10 "2024-01-29T22:21:43Z")
I think it would be better to output the z-coordinate and z-component of the flow velocity as well to confirm that the flow is really two-dimensional.
---
### Author:  [@Nafiz375](https://discourse.paraview.org/u/Nafiz375)
#### Post date: [January 29, 2024, 11:16pm UTC](https://discourse.paraview.org/t/extracting-stream-wise-u-x-and-span-wise-u-y-velocities-from-a-specified-sub-domain/13772/11 "2024-01-29T23:16:29Z")
This simulation is in 3D. I extracted the data from the XY plane, as mentioned above. I extracted initially to check, and its okay.
---
### Author:  [@Kenichiro-Yoshimi](https://discourse.paraview.org/u/Kenichiro-Yoshimi)
#### Post date: [January 30, 2024, 6:19am UTC](https://discourse.paraview.org/t/extracting-stream-wise-u-x-and-span-wise-u-y-velocities-from-a-specified-sub-domain/13772/12 "2024-01-30T06:19:47Z")
Sorry I did not read it carefully. I understood that the vtm files you are reading in the Python code above is the result on the xy plane. Is it possible to share just one of those vtm files?
---
### Author:  [@Nafiz375](https://discourse.paraview.org/u/Nafiz375)
#### Post date: [January 30, 2024, 3:15pm UTC](https://discourse.paraview.org/t/extracting-stream-wise-u-x-and-span-wise-u-y-velocities-from-a-specified-sub-domain/13772/13 "2024-01-30T15:15:34Z")
Hello Kyoshimi,
I’ve uploaded one of my VTM files that is for the final iteration.
[3.57\_deg\_1347.vtm](https://discourse.paraview.org/uploads/short-url/upkGOzutLoXVNRgOdDct95PiymO.vtm) (744 Bytes)