# FFT on plot data over time
**URL:** https://discourse.paraview.org/t/fft-on-plot-data-over-time/4811
**Category:** ParaView Support
**Created:** [July 10, 2020, 6:51pm UTC](https://discourse.paraview.org/t/fft-on-plot-data-over-time/4811 "2020-07-10T18:51:27Z")
**Posts on this page:** 11
**Page:** 1
### Author:  [@arinh](https://discourse.paraview.org/u/arinh)
#### Post date: [July 10, 2020, 6:51pm UTC](https://discourse.paraview.org/t/fft-on-plot-data-over-time/4811/1 "2020-07-10T18:51:27Z")
Hi all,
I am importing a data set of .vtu files and used the “Plot data over time” filter to plot my data. I now want to apply a FFT using the “FFT of selection over time” and I get an error that says “No time steps in input data”. I am plotting time vs. velocity. Has anyone successfully used the FFT Filter on a set of data. Can’t find any sources on the web. Thanks in advance!
---
### Author:  [@mwestphal](https://discourse.paraview.org/u/mwestphal)
#### Post date: [July 13, 2020, 8:33am UTC](https://discourse.paraview.org/t/fft-on-plot-data-over-time/4811/2 "2020-07-13T08:33:06Z")
> [@arinh](#):
>
> I am importing a data set of .vtu files
Are you using file series ? Please share an image of your pipeline browser.
---
### Author:  [@Kenneth\_Moreland](https://discourse.paraview.org/u/Kenneth_Moreland)
#### Post date: [July 13, 2020, 3:00pm UTC](https://discourse.paraview.org/t/fft-on-plot-data-over-time/4811/3 "2020-07-13T15:00:19Z")
I’m guessing that you need to run the `FFT Of Selection Over Time` filter before adding the `Plot Data Over Time`. The `FFT Of Selection Over Time` filter will automatically pull data over time. So does the `Plot Data Over Time`, and these filters confuse each other.
---
### Author:  [@arinh](https://discourse.paraview.org/u/arinh)
#### Post date: [July 13, 2020, 5:56pm UTC](https://discourse.paraview.org/t/fft-on-plot-data-over-time/4811/4 "2020-07-13T17:56:32Z")
Hi,
Yes I am, here is how the pipeline browser looks. 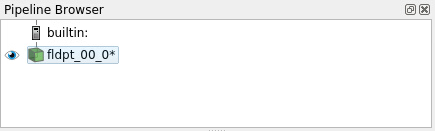
---
### Author:  [@arinh](https://discourse.paraview.org/u/arinh)
#### Post date: [July 13, 2020, 6:10pm UTC](https://discourse.paraview.org/t/fft-on-plot-data-over-time/4811/5 "2020-07-13T18:10:22Z")
Hello!
When first applying the FFT filter, we get no plot visual or data shown on the left.

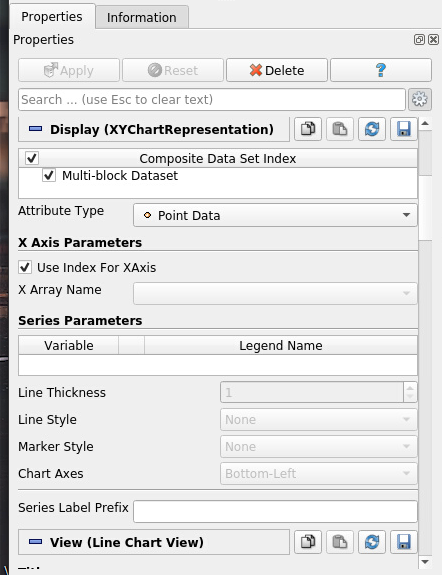
When applying the “Plot data over time” first, we get visuals and data to choose on the left.
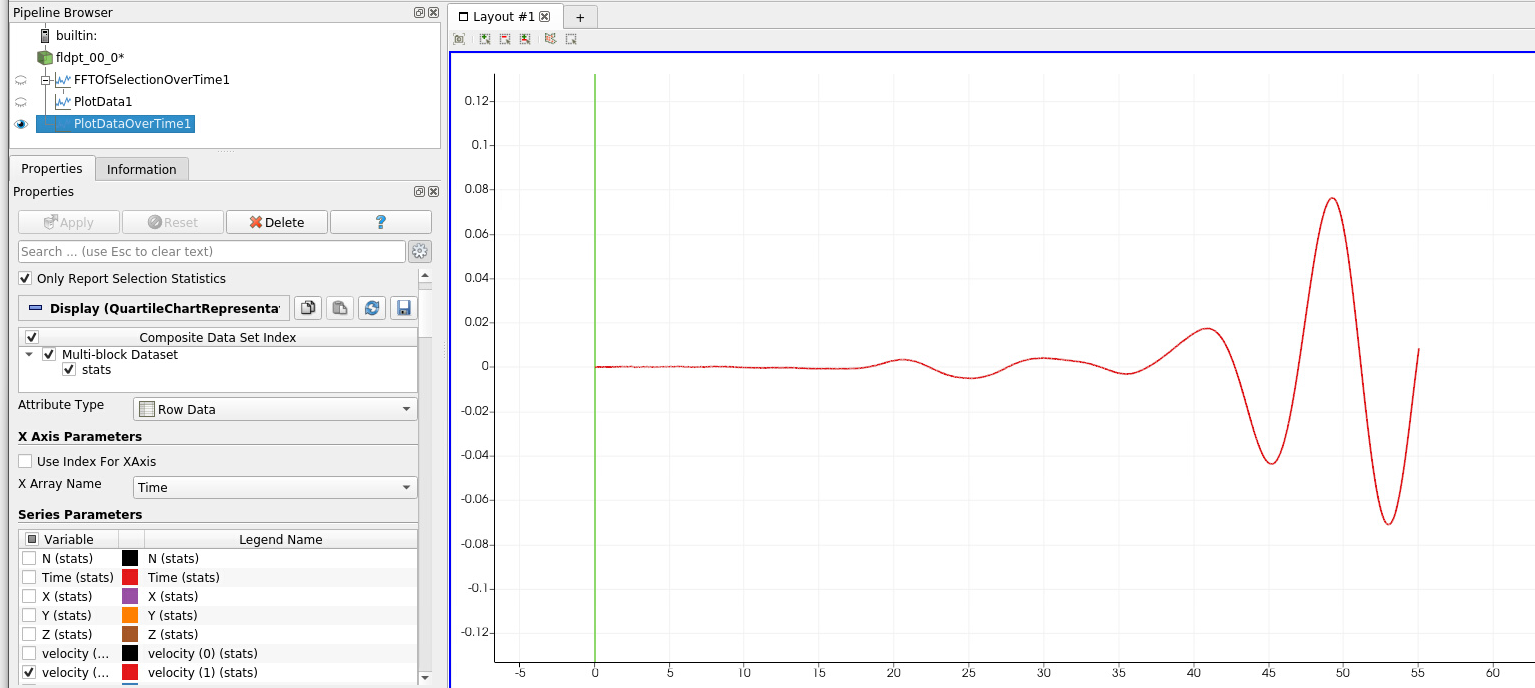
When trying to apply “FFT filter” onto the “Plot data over time”, I get an error like so,

Thanks for the help in advance!
---
### Author:  [@Kenneth\_Moreland](https://discourse.paraview.org/u/Kenneth_Moreland)
#### Post date: [July 13, 2020, 6:40pm UTC](https://discourse.paraview.org/t/fft-on-plot-data-over-time/4811/6 "2020-07-13T18:40:25Z")
This might be easier if you could post some example data.
Like I said, running `FFT Of Selection Over Time` on the output of `Plot Data Over Time` just won’t work.
It’s weird that the selection box says the `Process ID` is `-1`. Try making the selection again and hitting the `Copy Active Selection` button.
---
### Author:  [@arinh](https://discourse.paraview.org/u/arinh)
#### Post date: [July 13, 2020, 6:54pm UTC](https://discourse.paraview.org/t/fft-on-plot-data-over-time/4811/7 "2020-07-13T18:54:13Z")
Hi Kenneth,
The process ID is no longer -1. Here’s screenshot after applying the FFT Filter. I checked the vtkValidPointMask (id=0) box to see the horizontal black line.
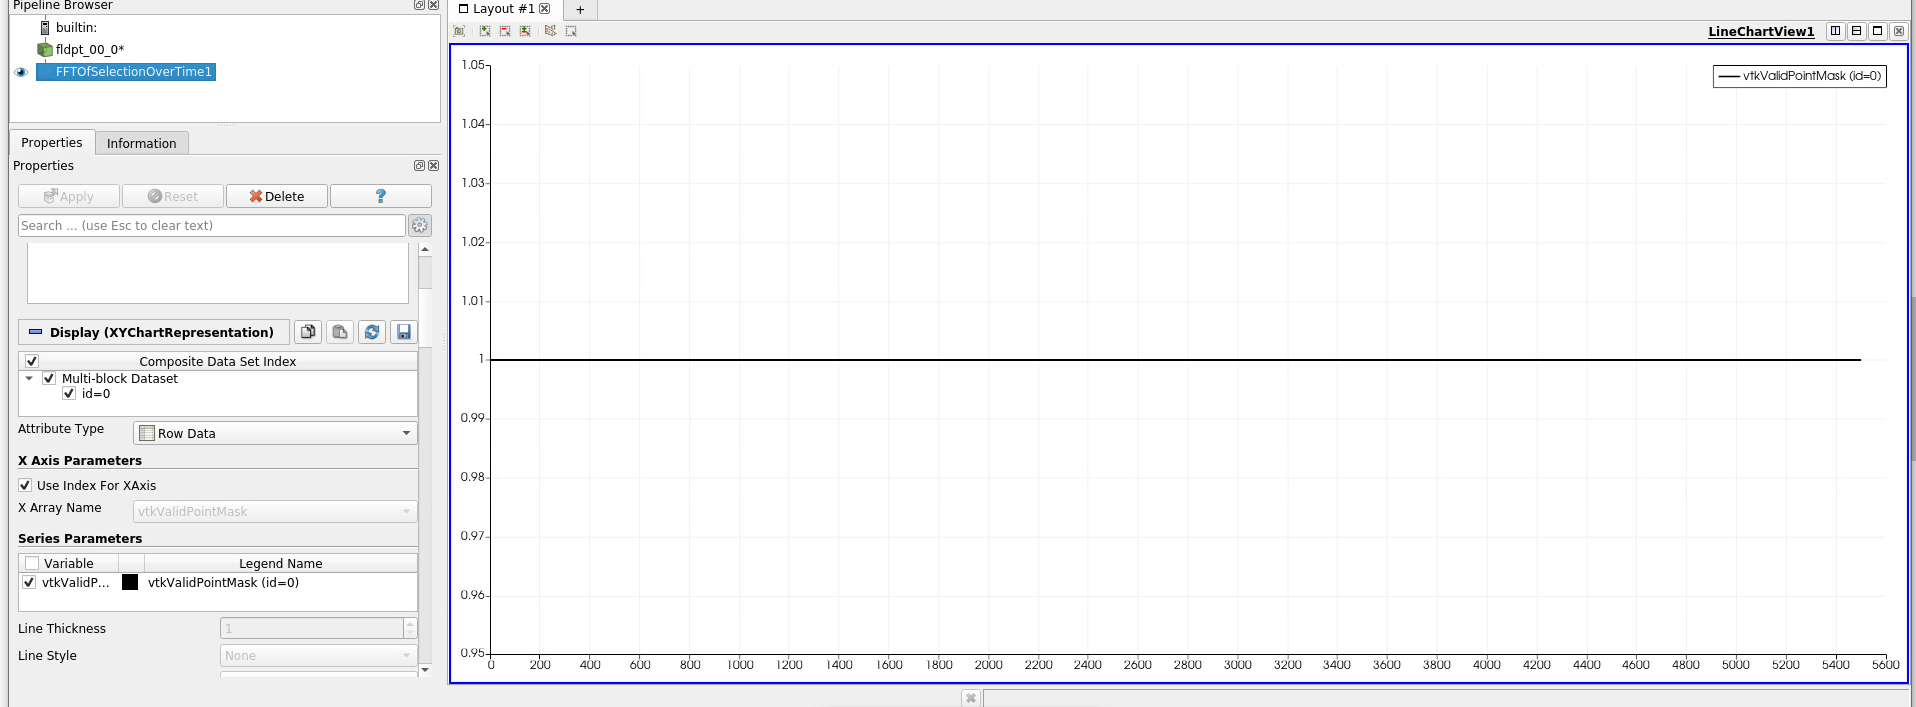
I feel we are a step closer. I was looking to apply it to the y-velocity (in red) from my previous replies.
Thank you!
---
### Author:  [@Kenneth\_Moreland](https://discourse.paraview.org/u/Kenneth_Moreland)
#### Post date: [July 13, 2020, 7:36pm UTC](https://discourse.paraview.org/t/fft-on-plot-data-over-time/4811/8 "2020-07-13T19:36:24Z")
Is your selection of the same type as the field data you are taking an FFT of? If you are taking an FFT of point data, is it a point selection? If you are taking an FFT of cell data, is it a cell selection?
Also, I believe the FFT only works on scalar data. If you are trying to take the FFT of vectors, you will have to use the `Calculator` filter to first extract whatever components or magnitude you want an FFT of.
---
### Author:  [@arinh](https://discourse.paraview.org/u/arinh)
#### Post date: [July 13, 2020, 8:24pm UTC](https://discourse.paraview.org/t/fft-on-plot-data-over-time/4811/9 "2020-07-13T20:24:51Z")
Hi Kenneth,
I applied the Calculator filter, set it to scalar velocity\_y, then applied the FFT filter onto the Calculator Filter, and here are the results. I also trimmed my data from my previous replies from [0, 55] to [44, 55].

I was looking to apply the FFT filter to find the frequencies. It seems the x-axis is time.
Thanks!!
---
### Author:  [@Kenneth\_Moreland](https://discourse.paraview.org/u/Kenneth_Moreland)
#### Post date: [July 13, 2020, 9:05pm UTC](https://discourse.paraview.org/t/fft-on-plot-data-over-time/4811/10 "2020-07-13T21:05:58Z")
The X axis is not time. It is just the index into the array. The `FFT Of Selection Over Time` filter does not compute the frequencies, so the plot just gives you the indices of the array holding the values computed by the FFT. The frequencies wouldn’t mean much anyway since the the vtu file series does not properly mark time anyway.
Since both `FFT Of Selection Over Time` and `Plot Data Over Time` are using array indices for the x axis, and both arrays are the same length, they look the same. But they do not have the same meaning.
---
### Author:  [@arinh](https://discourse.paraview.org/u/arinh)
#### Post date: [July 14, 2020, 5:08pm UTC](https://discourse.paraview.org/t/fft-on-plot-data-over-time/4811/11 "2020-07-14T17:08:37Z")
Hi Kenneth,
Yes, I understand now. The plot from my previous reply is just what I was going for. Thank you very much for your help.