# filter 'Plot over line' gives nan values
**URL:** https://discourse.paraview.org/t/filter-plot-over-line-gives-nan-values/11337
**Category:** ParaView Support
**Created:** [February 6, 2023, 1:18am UTC](https://discourse.paraview.org/t/filter-plot-over-line-gives-nan-values/11337 "2023-02-06T01:18:40Z")
**Posts on this page:** 8
**Page:** 1
### Author:  [@Leo0806](https://discourse.paraview.org/u/Leo0806)
#### Post date: [February 6, 2023, 1:18am UTC](https://discourse.paraview.org/t/filter-plot-over-line-gives-nan-values/11337/1 "2023-02-06T01:18:40Z")
Hi
I am working with a 2d Tecplot file with a .plt extension. I want a graph of parameters like velocity along a line. So I used the function “plot over line”, but I got no chart in return. When I look at the spreadsheet view of “plot over line”, there are Nan values for all parameters. Can you help me with this?
Say, I would like to plot U\_Uj along a line with Point1 (0,0,0) and Point2 (25,0,0).
[https://drive.google.com/drive/folders/1TxcMiIFsTCZQ6yocl6dj66Khb3XpLvhe?usp=share\_link](https://drive.google.com/drive/folders/1TxcMiIFsTCZQ6yocl6dj66Khb3XpLvhe?usp=share_link)
Thank you
---
### Author:  [@mwestphal](https://discourse.paraview.org/u/mwestphal)
#### Post date: [February 6, 2023, 11:56am UTC](https://discourse.paraview.org/t/filter-plot-over-line-gives-nan-values/11337/2 "2023-02-06T11:56:23Z")
Hi @Leo0806
Which version of ParaView are you using ? PlotOverLine on 2D data was recently fixed.
Best,
---
### Author:  [@Kenneth\_Moreland](https://discourse.paraview.org/u/Kenneth_Moreland)
#### Post date: [February 6, 2023, 3:18pm UTC](https://discourse.paraview.org/t/filter-plot-over-line-gives-nan-values/11337/3 "2023-02-06T15:18:34Z")
I took a look at your data, and it does not appear to be correct. Your data looks like it is supposed to define a volume; it has many of hexahedra. However, the Z component of the coordinates seem to be missing. The entire volume is squashed onto the x-y plane. Because all the hexahedra lie on a plane, they are degenerate and this is fouling up the intersection queries necessary for the `Plot Over Line` filter. Even if the intersection queries did work, the results could be problematic as at every point you have many flattened cells overlapping each other. Which one should the plotter choose?
The best solution would be to go back and check your data. It does not seem to be generated correctly. If having a volume flattened onto the x-y plane is really want you want (which makes little sense), you can get the `Plot Over Line` filter to work by running the `Extract Surface` filter. This will pull out some quadrilateral faces that will intersect with the line correctly.
---
### Author:  [@Leo0806](https://discourse.paraview.org/u/Leo0806)
#### Post date: [March 1, 2023, 1:21pm UTC](https://discourse.paraview.org/t/filter-plot-over-line-gives-nan-values/11337/4 "2023-03-01T13:21:20Z")
Sorry for the late reply!
I actually tried opening the Tecplot file in Tecplot 360. It worked well, showing the correct 3D volume mesh. However, when I open it in Paraview, it seems to be mistaken and shows the 2D volume mesh squashed onto the x-y plane.
Is this a problem with Paravire reading the Tecplot file? If yes, is it possible to fix it? Thank you!
---
### Author:  [@Kenneth\_Moreland](https://discourse.paraview.org/u/Kenneth_Moreland)
#### Post date: [March 1, 2023, 6:21pm UTC](https://discourse.paraview.org/t/filter-plot-over-line-gives-nan-values/11337/5 "2023-03-01T18:21:51Z")
Hmm. This could be a problem with the reader.
This Tecplot reader is one of those in the VisitBridge, which means that the reader comes from the VisIt developer team. I just tried loading your data in the most recent version of VisIt (3.3.2) and got the same behavior. So, if it is an issue with the reader, it would at best take a long time for the fix to make it to ParaView. (See for example [Issue with tecplot binary cell centered data.](https://discourse.paraview.org/t/issue-with-tecplot-binary-cell-centered-data/10428) for a different problem with the same reader.)
That said, I took another look at your data, and it appears that the coordinates are repeated in the `x_D`, `y_D` and `z_D` fields, and the `z_D` field is actually correct. So, you can use the `Calculator` filter to fix the coordinates. Turn on the `Coordinate Results` checkbox and set the expression to `coords + z_D*kHat`.
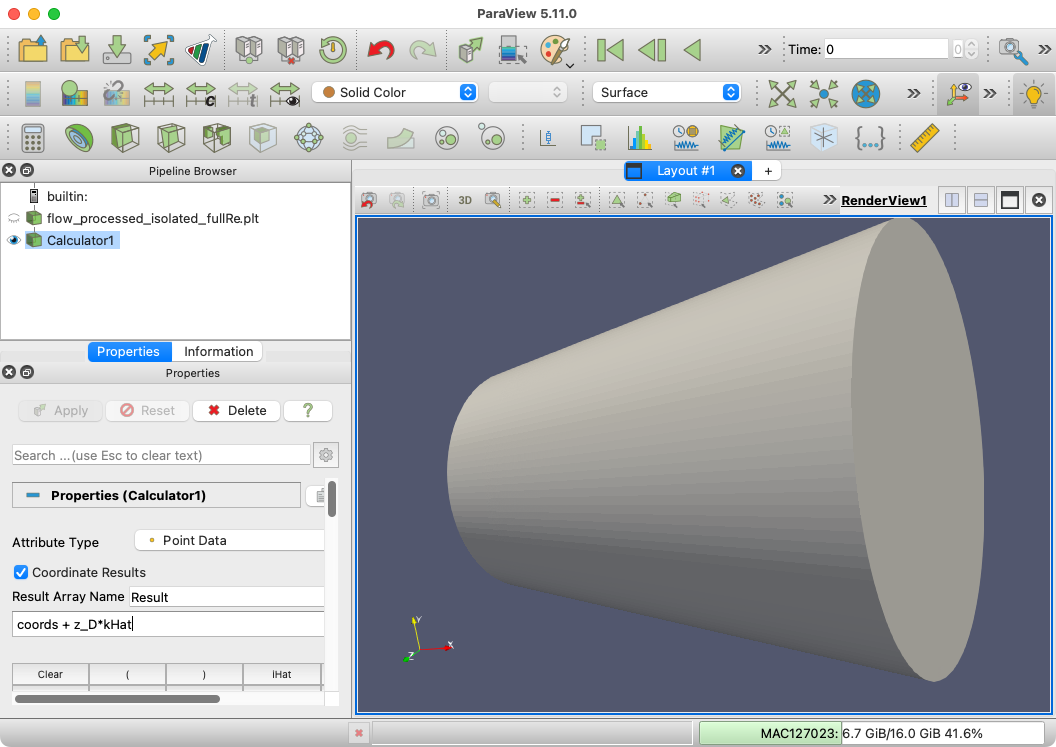
After you fix the coordinates, you may need to change to 3D interaction in the view. Click the `2D` in the small toolbar over the render view to change it to `3D`.
Here is a state file that enacts this fix: [fixed-coordinates.pvsm](https://discourse.paraview.org/uploads/short-url/jjDhNu0Vo69ROxw08MNmtcZVJoS.pvsm) (299.5 KB)
---
### Author:  [@Leo0806](https://discourse.paraview.org/u/Leo0806)
#### Post date: [March 2, 2023, 2:35am UTC](https://discourse.paraview.org/t/filter-plot-over-line-gives-nan-values/11337/6 "2023-03-02T02:35:19Z")
Dear Kenneth,
Thank you so much! This indeed solves the issue.
---
### Author:  [@Leo0806](https://discourse.paraview.org/u/Leo0806)
#### Post date: [March 3, 2023, 5:18pm UTC](https://discourse.paraview.org/t/filter-plot-over-line-gives-nan-values/11337/7 "2023-03-03T17:18:09Z")
Dear Kenneth,
I am very new to ParaView and not familiar with it. I am stuck with plotting on a plane. Say, I want to plot U\_Uj \* (d U\_Uj / d x) on a rectangle, z=0, 1\
### Author:  [@Kenneth\_Moreland](https://discourse.paraview.org/u/Kenneth_Moreland)
#### Post date: [March 3, 2023, 8:38pm UTC](https://discourse.paraview.org/t/filter-plot-over-line-gives-nan-values/11337/8 "2023-03-03T20:38:48Z")
This is a new question (actually 2 new questions), and that is usually best asked on a whole new thread. But I’ll answer them here.
The first question is how to derive U\_Uj \* (d U\_Uj / d x), Your data has a `U_Uj` field. You can get the derivative in each direction by using the `Gradient` filter. You can then use the `Calculator` filter to multiple `U_Uj` with the x component of the gradient.
The second question is how to plot on a plane. You can do that in ParaView by using the `Slice` filter . Click the `Z Normal` button and ensure the origin has the z component as 0 to slice along the z=0 plane.
That will give you the slice along the entire domain. You can zoom to the part you want, or you can use the `Clip` filter . Change the
`Clip Type` to `Box`. Then change `Position` to 1, 1, -1 and `Length` to 2, 2, 2 to get the 1\