# Filters expressions for charts
**URL:** https://discourse.paraview.org/t/filters-expressions-for-charts/16382
**Category:** Development
**Created:** [March 25, 2025, 8:52am UTC](https://discourse.paraview.org/t/filters-expressions-for-charts/16382 "2025-03-25T08:52:35Z")
**Posts on this page:** 2
**Page:** 1
### Author:  [@jeDuck](https://discourse.paraview.org/u/jeDuck)
#### Post date: [March 25, 2025, 8:52am UTC](https://discourse.paraview.org/t/filters-expressions-for-charts/16382/1 "2025-03-25T08:52:35Z")
Paraview has an option to hide some arrays via Filters Expressions in settings. Is there a way to do the same in the table for charts? It is possible to control visibility of charts, but is there a way to hide arrays from the table, just like color array? Maybe it is possible programmatically via C++?
---
### Author:  [@cory.quammen](https://discourse.paraview.org/u/cory.quammen)
#### Post date: [March 25, 2025, 2:11pm UTC](https://discourse.paraview.org/t/filters-expressions-for-charts/16382/2 "2025-03-25T14:11:17Z")
Yes, further down the same settings panel (“Represented Attributes”) is a list of arrays to not display in charts.
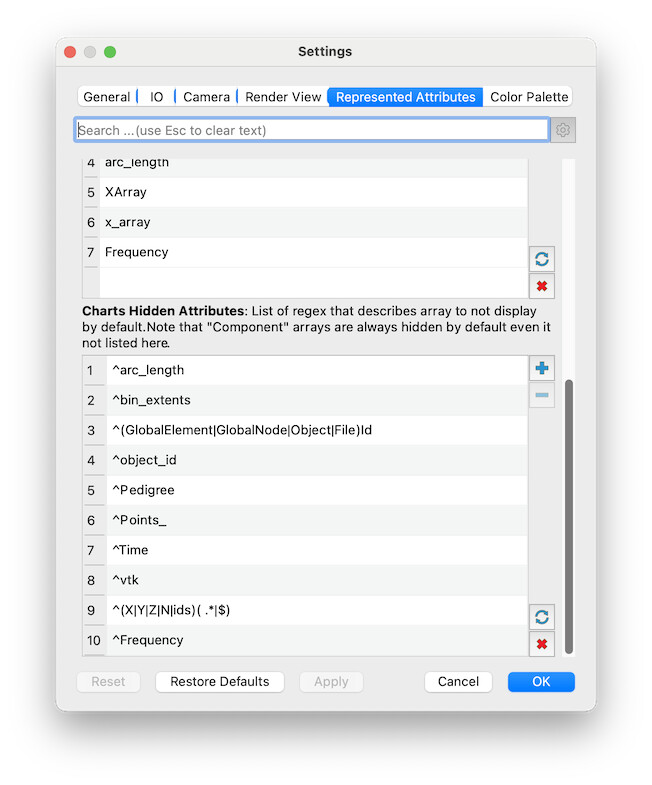
This is available in ParaView 5.12 and later.