# Graphs in Paraview
**URL:** https://discourse.paraview.org/t/graphs-in-paraview/8966
**Category:** ParaView Support
**Created:** [February 14, 2022, 7:32am UTC](https://discourse.paraview.org/t/graphs-in-paraview/8966 "2022-02-14T07:32:27Z")
**Posts on this page:** 2
**Page:** 1
### Author:  [@PALANI](https://discourse.paraview.org/u/PALANI)
#### Post date: [February 14, 2022, 7:32am UTC](https://discourse.paraview.org/t/graphs-in-paraview/8966/1 "2022-02-14T07:32:27Z")
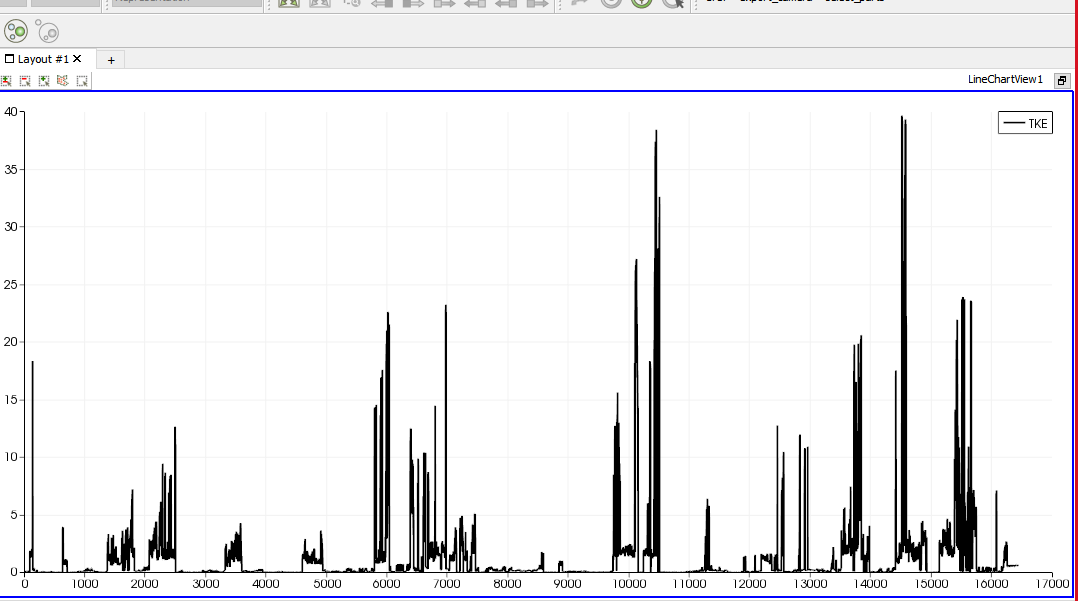
Can I change the parameter in the x axis and y fpr the graphs ?
---
### Author:  [@mwestphal](https://discourse.paraview.org/u/mwestphal)
#### Post date: [February 14, 2022, 9:15am UTC](https://discourse.paraview.org/t/graphs-in-paraview/8966/2 "2022-02-14T09:15:35Z")
Yes, all can be changed in the properties panel on the left.