# Groupby RegionID ( Connecitivity )
**URL:** https://discourse.paraview.org/t/groupby-regionid-connecitivity/10280
**Category:** ParaView Support
**Created:** [September 9, 2022, 6:54am UTC](https://discourse.paraview.org/t/groupby-regionid-connecitivity/10280 "2022-09-09T06:54:17Z")
**Posts on this page:** 5
**Page:** 1
### Author:  [@Khem](https://discourse.paraview.org/u/Khem)
#### Post date: [September 9, 2022, 6:54am UTC](https://discourse.paraview.org/t/groupby-regionid-connecitivity/10280/1 "2022-09-09T06:54:17Z")
Dear all,
After I apply the connectivity filter I manage to get a nice dataset grouped by Region ID.
Currently, I am saving the output of the connectivity filter as Table.CSV and using pandas to Table.groupby(‘RegionID’).mean(). This computes the mean and gives me a nice table but the group table is not renderable and matching Region ID to the geometry is a bit tiresome.
Is it possible to compute mean values natively on Paraview and also render the quantity using the original coordinates? For example, if Cells in RegionID 1, have an average U mag of 5 M/s, I want a display that shows all cells in RegionID 1 with a value of 5.
---
### Author:  [@Kenichiro-Yoshimi](https://discourse.paraview.org/u/Kenichiro-Yoshimi)
#### Post date: [September 10, 2022, 5:54am UTC](https://discourse.paraview.org/t/groupby-regionid-connecitivity/10280/2 "2022-09-10T05:54:56Z")
Hi Khem,
One way would be to use the **Programmable Filter** after creating the `RegionId` in the **Connectivity Filter**. For example, the following script averages the specified `Point Data` within the region extracted by `RegionId` and adds a new array of averages.
```python
import numpy as np
import vtk
from vtk.util.numpy_support import numpy_to_vtk
input0 = inputs[0]
# Specify the name of the Poind Data array for which
# the average is to be calculated.
array_name = 'DistanceToCenter'
# Extracts the region by RegionId, takes the average of
# the specified variables within it,
# and creates a new variable array of the average values.
region_ids = input0.PointData['RegionId']
appender = vtk.vtkAppendFilter()
for id in range(np.max(region_ids)+1):
# Extract the region by id.
threshold = vtk.vtkThreshold()
threshold.SetInputData(input0.VTKObject)
threshold.SetInputArrayToProcess(
0, 0, 0, vtk.vtkDataObject.FIELD_ASSOCIATION_POINTS, 'RegionId')
threshold.SetLowerThreshold(id)
threshold.SetUpperThreshold(id)
threshold.SetAllScalars(1)
threshold.Update()
extracted = threshold.GetOutput()
num = extracted.GetNumberOfPoints()
# Calculates the average value of the specified variable and stores it in a new array.
var = extracted.GetPointData().GetArray(array_name)
np_means = np.array([np.mean(var)]*num)
vtk_means = numpy_to_vtk(num_array=np_means, deep=True, array_type=vtk.VTK_DOUBLE)
vtk_means.SetName(f'{array_name}_mean')
extracted.GetPointData().AddArray(vtk_means)
# Integrate each area.
appender.AddInputData(extracted)
appender.Update()
output.ShallowCopy(appender.GetOutput())
```
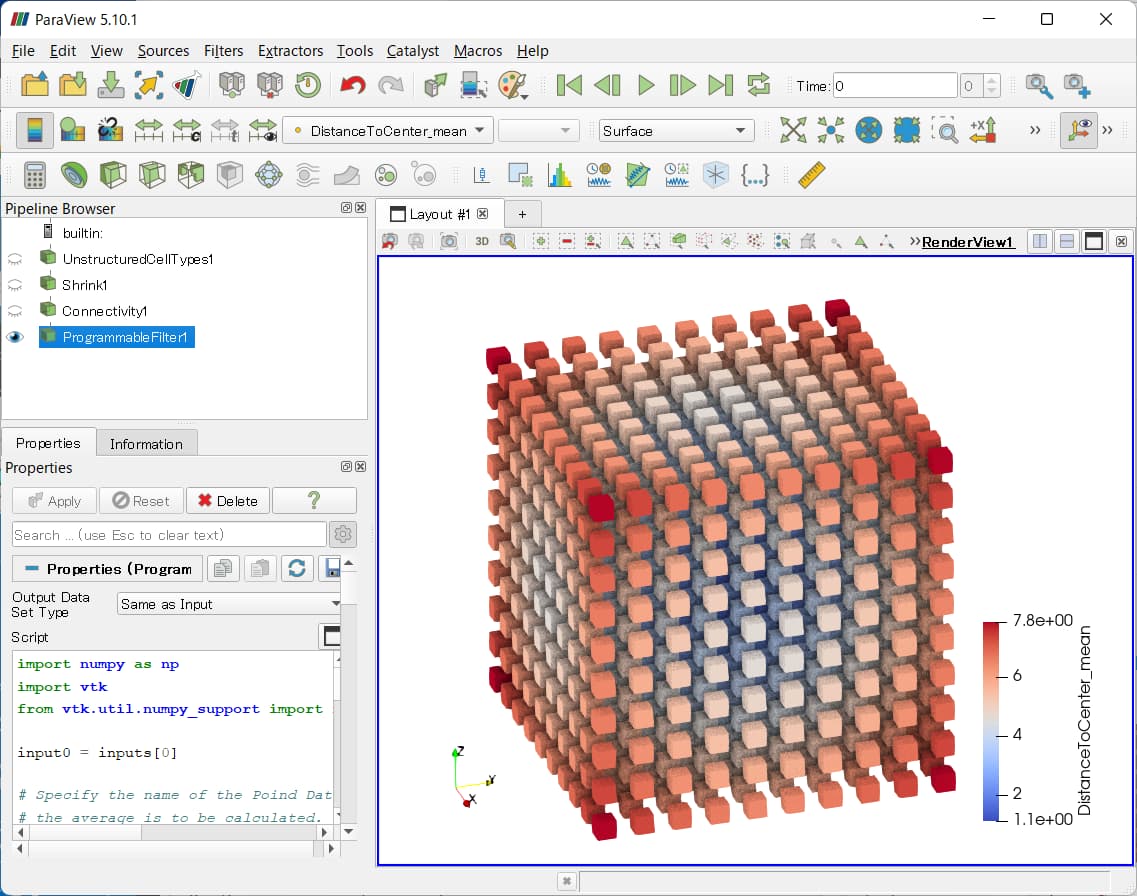
Also attached is a State file for the above.
[programmable.pvsm](https://discourse.paraview.org/uploads/short-url/6lkVcUXsnHyn3L1qu72b77yvsxa.pvsm) (581.7 KB)
Note that when targeting `Cell Data` or `Vector Data`, the above script must be modified accordingly.
---
### Author:  [@Khem](https://discourse.paraview.org/u/Khem)
#### Post date: [September 12, 2022, 6:27am UTC](https://discourse.paraview.org/t/groupby-regionid-connecitivity/10280/3 "2022-09-12T06:27:55Z")
Hi Kenichiro-Yoshimi,
Thank you so going to the length to answer my question.
How can I modify the code so it works for VTKCompositeDataArray? I get the following error when using it for my case:
Traceback (most recent call last):
File “”, line 22, in
File “”, line 15, in RequestData
TypeError: ‘VTKCompositeDataArray’ object cannot be interpreted as an integer
Traceback (most recent call last):
File “”, line 22, in
File “”, line 15, in RequestData
TypeError: ‘VTKCompositeDataArray’ object cannot be interpreted as an integer
---
### Author:  [@Kenichiro-Yoshimi](https://discourse.paraview.org/u/Kenichiro-Yoshimi)
#### Post date: [September 12, 2022, 10:02am UTC](https://discourse.paraview.org/t/groupby-regionid-connecitivity/10280/4 "2022-09-12T10:02:19Z")
Hi,
It may be easier to merge data with the **Merge Blocks** filter than to modify the code.
---
### Author:  [@Khem](https://discourse.paraview.org/u/Khem)
#### Post date: [September 12, 2022, 10:53am UTC](https://discourse.paraview.org/t/groupby-regionid-connecitivity/10280/5 "2022-09-12T10:53:17Z")
Thank you [Kyoshimi]
My problem is solved now!