# Hello,
**URL:** https://discourse.paraview.org/t/hello/10581
**Category:** ParaView Support
**Created:** [October 24, 2022, 2:05am UTC](https://discourse.paraview.org/t/hello/10581 "2022-10-24T02:05:46Z")
**Posts on this page:** 5
**Page:** 1
### Author:  [@tkdgur8314](https://discourse.paraview.org/u/tkdgur8314)
#### Post date: [October 24, 2022, 2:05am UTC](https://discourse.paraview.org/t/hello/10581/1 "2022-10-24T02:05:46Z")
Hello, I have a question about the current CFD computational fluid dynamics. I would like to display data through cell number, speed, pressure, and temperature for RM flow dynamics required through text file. I wonder if there are any related materials.
Currently, it is difficult to use Paraview, so we need a tutorial course.
---
### Author:  [@mwestphal](https://discourse.paraview.org/u/mwestphal)
#### Post date: [October 24, 2022, 2:16am UTC](https://discourse.paraview.org/t/hello/10581/2 "2022-10-24T02:16:58Z")
Hello @tkdgur8314
You may want to take a look at the docs: [Welcome to ParaView Documentation ! — ParaView Documentation 5.10.0 documentation](https://docs.paraview.org/en/latest/)
Especially the self-directed tutorial: [Self-directed Tutorial — ParaView Documentation 5.10.0 documentation](https://docs.paraview.org/en/latest/Tutorials/SelfDirectedTutorial/index.html)
---
### Author:  [@tkdgur8314](https://discourse.paraview.org/u/tkdgur8314)
#### Post date: [October 24, 2022, 8:31am UTC](https://discourse.paraview.org/t/hello/10581/3 "2022-10-24T08:31:22Z")
Cell number, speed, pressure, and temperature exist in the current text file.
One frame per file of text.
There are 360,000 data in one file, and there are cell numbers, speeds, pressures, and temperatures.
Is it possible through scripting? Or is it impossible?
---
### Author:  [@mwestphal](https://discourse.paraview.org/u/mwestphal)
#### Post date: [October 24, 2022, 8:39am UTC](https://discourse.paraview.org/t/hello/10581/4 "2022-10-24T08:39:40Z")
This sounds possible, you need to try with your data.
---
### Author:  [@tkdgur8314](https://discourse.paraview.org/u/tkdgur8314)
#### Post date: [October 24, 2022, 8:55am UTC](https://discourse.paraview.org/t/hello/10581/5 "2022-10-24T08:55:16Z")
Thank you for your reply.
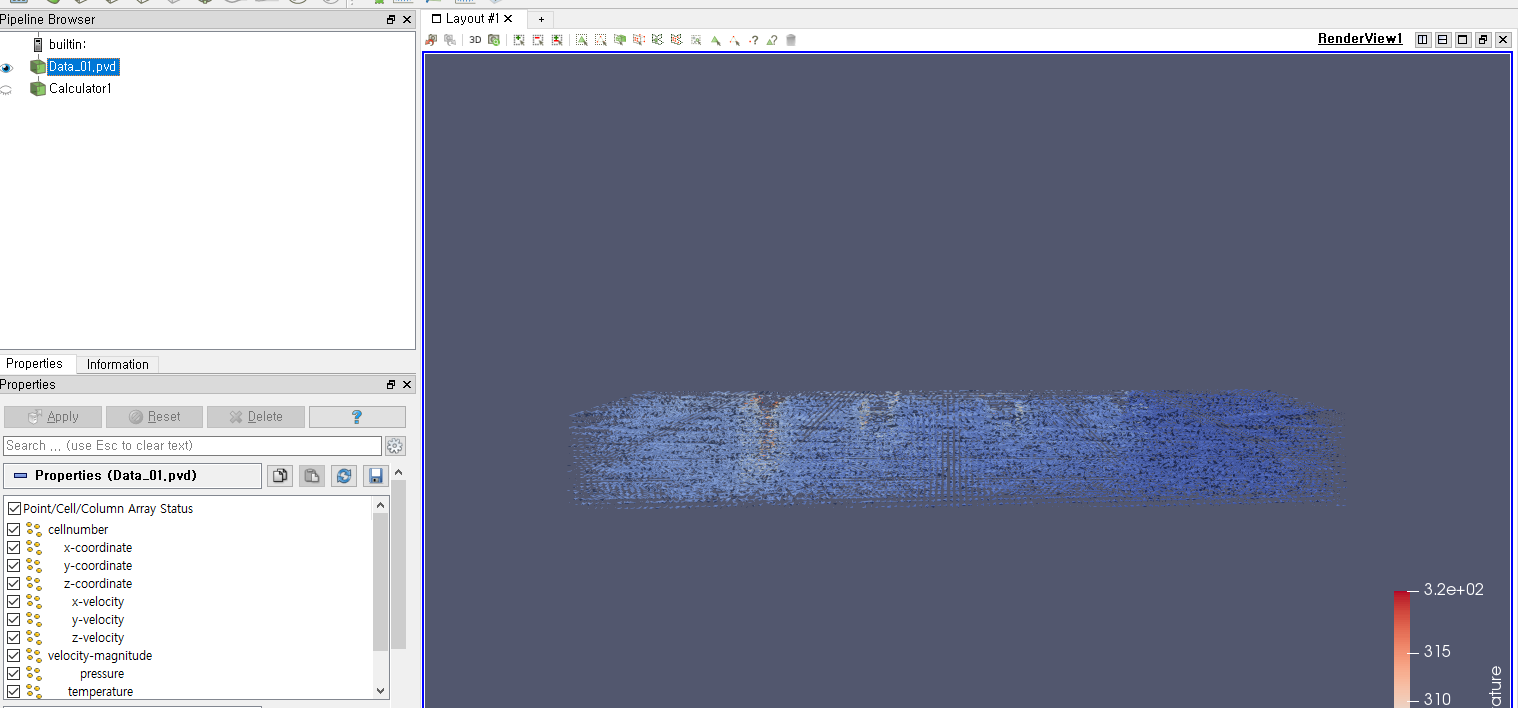
Currently, Codinate x, y, and z are created, and I want to make rotation and temperature pressure through the remaining speed.
Now it’s represented like a picture.
Do you mean Python script if you want to try it with data?