# Help documentation about the functions in Python script
**URL:** https://discourse.paraview.org/t/help-documentation-about-the-functions-in-python-script/10348
**Category:** ParaView Support
**Tags:** python
**Created:** [September 18, 2022, 10:45am UTC](https://discourse.paraview.org/t/help-documentation-about-the-functions-in-python-script/10348 "2022-09-18T10:45:55Z")
**Posts on this page:** 11
**Page:** 1
### Author:  [@ChangzhiZhai](https://discourse.paraview.org/u/ChangzhiZhai)
#### Post date: [September 18, 2022, 10:45am UTC](https://discourse.paraview.org/t/help-documentation-about-the-functions-in-python-script/10348/1 "2022-09-18T10:45:56Z")
Dear all,
I’m trying to use the Python script to set plots. I started trace and got some codes of the operations. When I wanted to modify the codes, I could not find the detailed help documentations of the functions. I tried `help` but the results did not give much useful information.
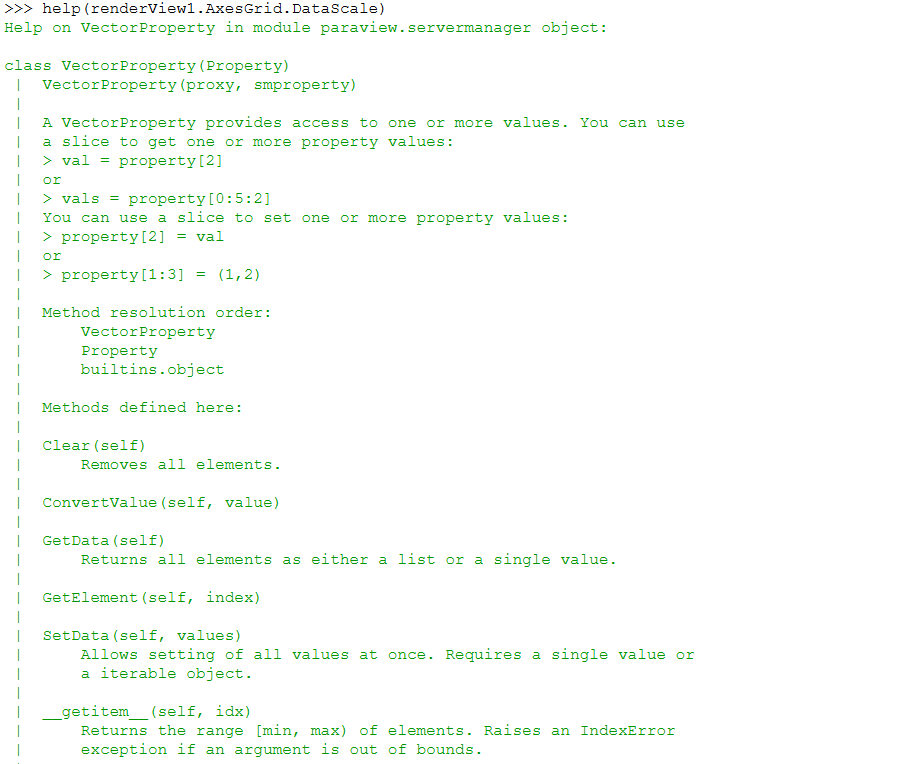
Where can I find the detailed documentation including description and examples of the functons like the matlab help documentation?
---
### Author:  [@mwestphal](https://discourse.paraview.org/u/mwestphal)
#### Post date: [September 19, 2022, 1:51am UTC](https://discourse.paraview.org/t/help-documentation-about-the-functions-in-python-script/10348/2 "2022-09-19T01:51:11Z")
Hi @ChangzhiZhai
The complete doc is here: [ParaView’s Python documentation! — ParaView/Python 5.11.0-RC1-109-g9c0a389cee documentation](https://kitware.github.io/paraview-docs/latest/python/)
What do you want to do exactly ? AxesGrid is not related directly to plots in ParaView.
---
### Author:  [@ChangzhiZhai](https://discourse.paraview.org/u/ChangzhiZhai)
#### Post date: [September 19, 2022, 11:59am UTC](https://discourse.paraview.org/t/help-documentation-about-the-functions-in-python-script/10348/3 "2022-09-19T11:59:25Z")
Hi Mathieu,
Thanks for your reply. I tried the link but I didn’t find the description of “AxesGrid”.
1. I want to set where to show the labels and what to show. For instance, I want to show 0, 100, 200 at x= 0, 10, 20.
2. I’m used to use code to control plots in matlab, so I want to trace the Python script and modify it in ParaView. But I can not find the detailed help documentation of the functions used in the python script.
3. What do you mean “AxesGrid is not related directly to plots in ParaView”? Are these functions in Python? I’m confused about the relationship between Python and ParaView
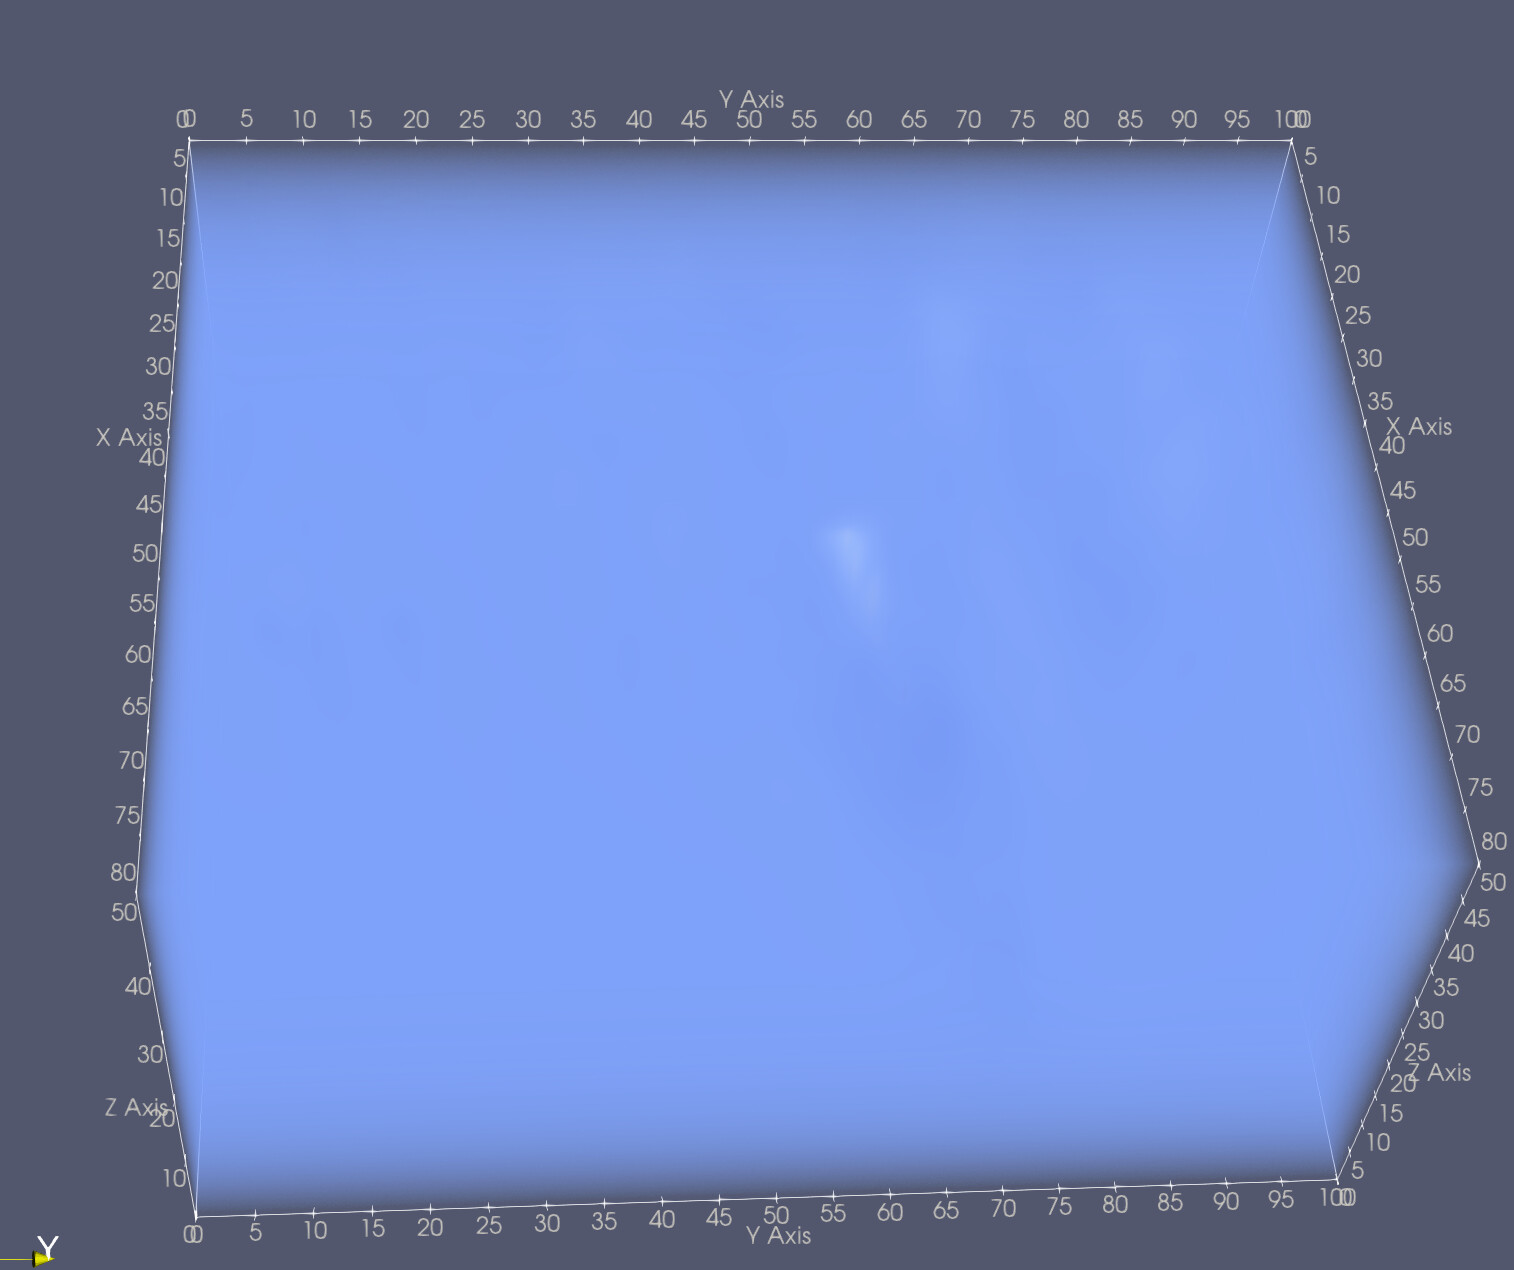
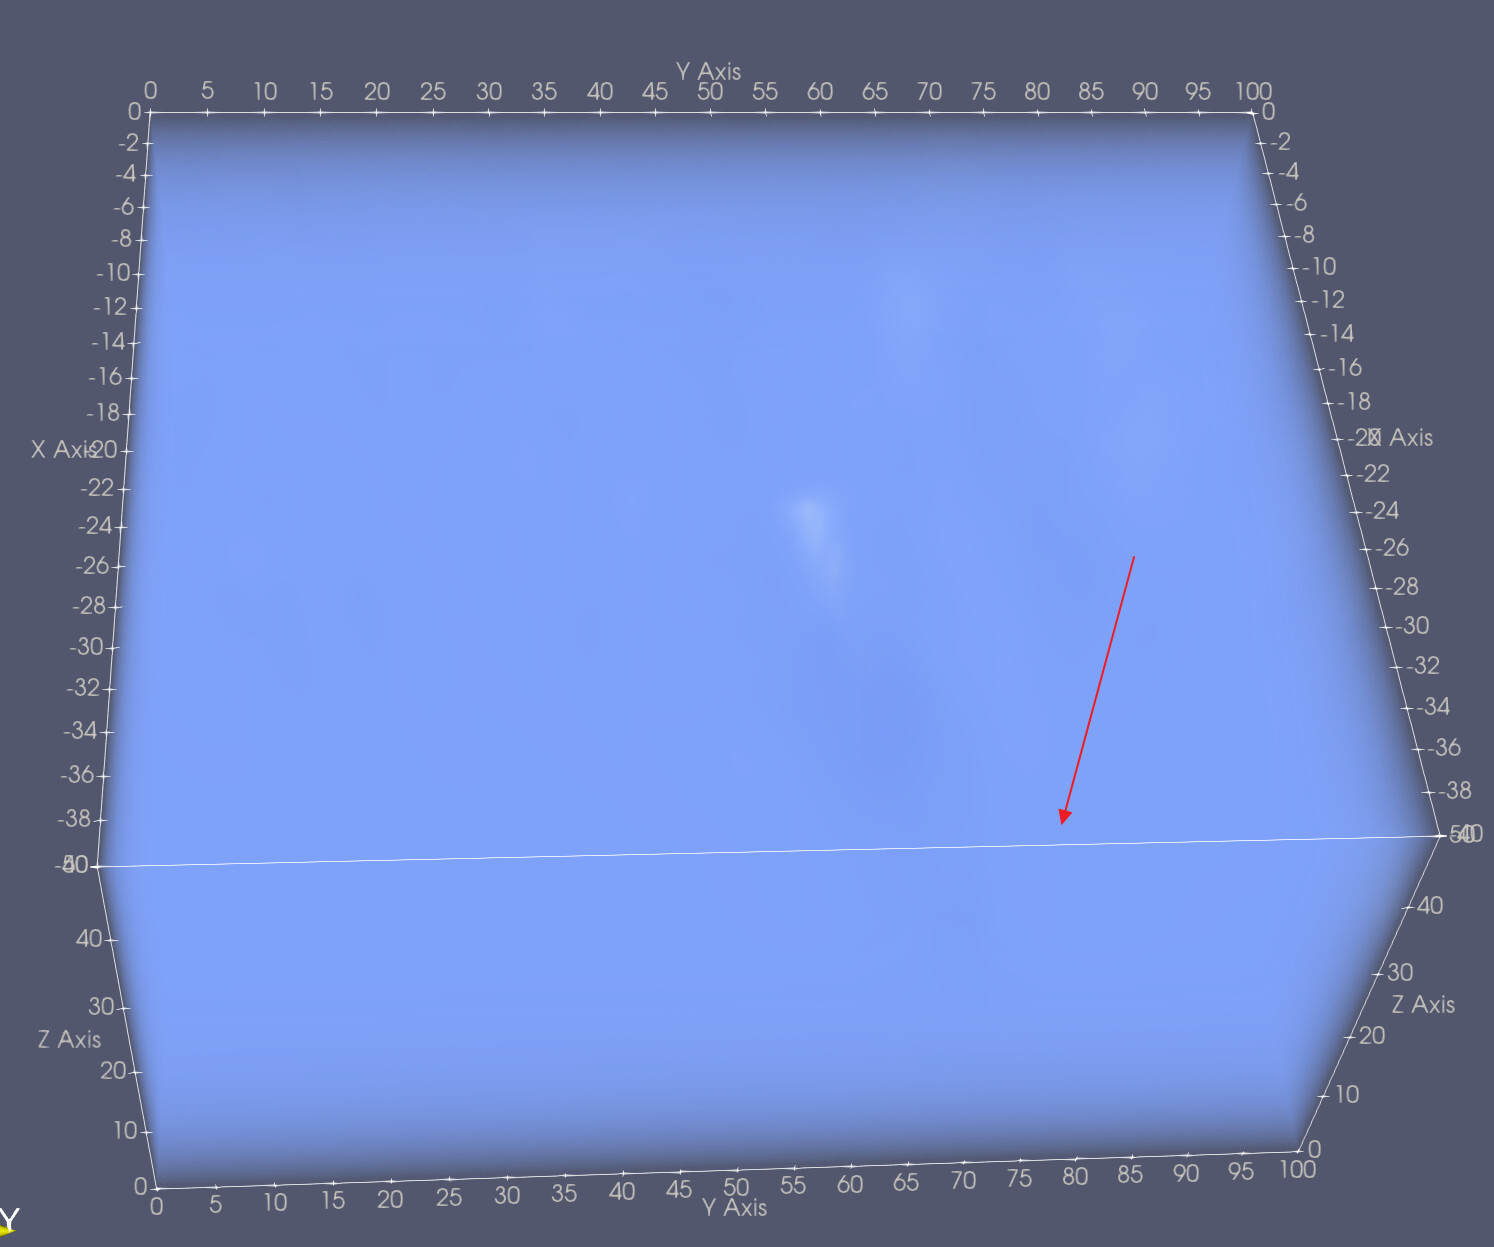
4. There is a Y axis infront of the rendered volume after I set the “Data Scale” in “Axes Grid”. Why does that happen? How can I remove the infront Y axis? Following are the screen shots of this problem

---
### Author:  [@mwestphal](https://discourse.paraview.org/u/mwestphal)
#### Post date: [September 20, 2022, 1:43am UTC](https://discourse.paraview.org/t/help-documentation-about-the-functions-in-python-script/10348/4 "2022-09-20T01:43:20Z")
I’m very confused, you are talking about plots but you are showing a 3D view volume rendering. what kind of plots are you trying to produce ?
---
### Author:  [@ChangzhiZhai](https://discourse.paraview.org/u/ChangzhiZhai)
#### Post date: [September 20, 2022, 4:30am UTC](https://discourse.paraview.org/t/help-documentation-about-the-functions-in-python-script/10348/5 "2022-09-20T04:30:21Z")
I’m sorry, maybe “plot” is ambiguous here. I am trying to generate 3D view volume rendering. I want to remove the infront upper Y axis in the view. I also want to use python script to control the 3D view including axis labels and other state.
---
### Author:  [@mwestphal](https://discourse.paraview.org/u/mwestphal)
#### Post date: [September 20, 2022, 5:51am UTC](https://discourse.paraview.org/t/help-documentation-about-the-functions-in-python-script/10348/6 "2022-09-20T05:51:33Z")
Got it. The simplest way to find out how to replicate in pvpython what you do in the GUI is to use the trace.
- Tools → PythonTrace → Show Incremental → Start
- Enable axes
- Look at the code in the python editor view.
---
### Author:  [@ChangzhiZhai](https://discourse.paraview.org/u/ChangzhiZhai)
#### Post date: [September 20, 2022, 6:03am UTC](https://discourse.paraview.org/t/help-documentation-about-the-functions-in-python-script/10348/7 "2022-09-20T06:03:33Z")
Thank you.
If I use the GUI, how should I remove the infront upper Y axis in the view?
---
### Author:  [@mwestphal](https://discourse.paraview.org/u/mwestphal)
#### Post date: [September 20, 2022, 6:16am UTC](https://discourse.paraview.org/t/help-documentation-about-the-functions-in-python-script/10348/8 "2022-09-20T06:16:29Z")
Hi @ChangzhiZhai ,
Please provide steps to reproduce in order to get this Y axis.
Best,
---
### Author:  [@ChangzhiZhai](https://discourse.paraview.org/u/ChangzhiZhai)
#### Post date: [September 20, 2022, 6:54am UTC](https://discourse.paraview.org/t/help-documentation-about-the-functions-in-python-script/10348/9 "2022-09-20T06:54:54Z")
1. Open the VTK file in paraview:
[NeNew\_0800.vtk](https://discourse.paraview.org/uploads/short-url/jXJZbaxPtQgoPgDXQyI7NbuMVTT.vtk) (1.6 MB)
2. Set the Representation as Volume, Coloring as Pressure
3. Check “Axes Grid”, edit the first Data scale parameter as -2
Apply, there is Y axis infront.

---
### Author:  [@mwestphal](https://discourse.paraview.org/u/mwestphal)
#### Post date: [September 21, 2022, 3:52am UTC](https://discourse.paraview.org/t/help-documentation-about-the-functions-in-python-script/10348/10 "2022-09-21T03:52:18Z")
I reproduce, definitely looks like a bug, please open an issue: [https://gitlab.kitware.com/paraview/paraview/-/issues](https://gitlab.kitware.com/paraview/paraview/-/issues)
---
### Author:  [@ChangzhiZhai](https://discourse.paraview.org/u/ChangzhiZhai)
#### Post date: [September 21, 2022, 11:02pm UTC](https://discourse.paraview.org/t/help-documentation-about-the-functions-in-python-script/10348/11 "2022-09-21T23:02:32Z")
OK, thank you.