# Help with filter "textureMaptoPlane".
**URL:** https://discourse.paraview.org/t/help-with-filter-texturemaptoplane/17261
**Category:** ParaView Support
**Created:** [October 25, 2025, 6:57am UTC](https://discourse.paraview.org/t/help-with-filter-texturemaptoplane/17261 "2025-10-25T06:57:20Z")
**Posts on this page:** 3
**Page:** 1
### Author:  [@antoinecollet5](https://discourse.paraview.org/u/antoinecollet5)
#### Post date: [October 25, 2025, 6:57am UTC](https://discourse.paraview.org/t/help-with-filter-texturemaptoplane/17261/1 "2025-10-25T06:57:20Z")
Hi there,
I try to visualize geological cross sections using Paraview. For this, I create a \*.vts using pyvista and then use the filter textureMaptoPlane. In the following I will give you an example with pyvista, and then show you my issue in Paraview.
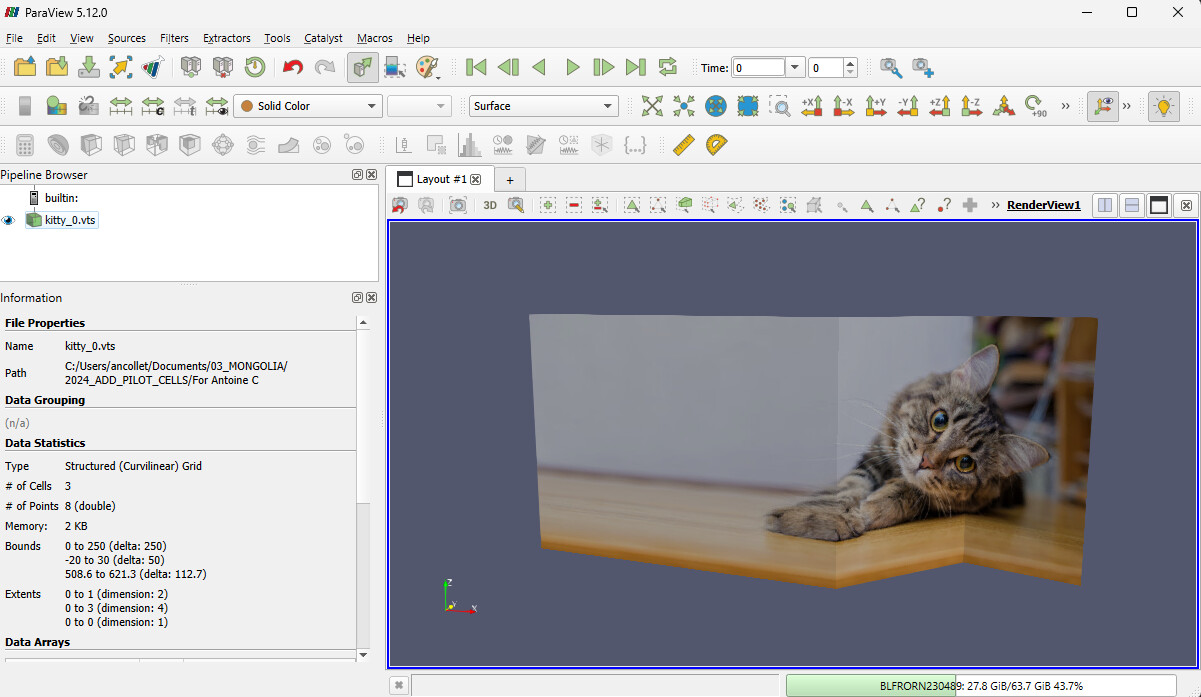
I will use the this free image from the web for the demonstration:

- Creation of the cross-section support from pyvista:
> from pathlib import Path
>
> import numpy as np
>
> import pyvista as pv
>
> from numpy.typing import ArrayLike
>
> def make\_cross\_section\_surface(
>
> ```auto
> section_xy_sequence: ArrayLike, section_z_min: float, section_z_max: float
>
> ```
>
> ) → pv.StructuredGrid:
>
> ```auto
> """
>
> Make a structured grid as a 3D support for a geological cross section.
>
> Parameters
>
> ----------
>
> section_xy_sequence : ArrayLike
>
> Coordinates x-y of the points defining the cross section surface line.
>
> section_z_min : float
>
> Minimum value of the cross section on the z-axis.
>
> section_z_max : float
>
> Maximum value of the cross section on the z-axis.
>
> Returns
>
> -------
>
> Tuple\[pv.StructuredGrid, np.typing.NDArray\[np.float64\]\]
>
> A pyvista stuctured grid with embedded texture coordinates that can be exported
>
> and saved as a \*.vts for vizualization in Paraview.
>
> """
>
> \# --- Step 1: Define the surface grid in 3D space ---
>
> \_section_xy_sequence = np.asarray(section_xy_sequence)
>
> n_points = \_section_xy_sequence.shape\[0\]
>
> n_z = 2 # bottom and top of the section
>
> \# Create grid coordinates
>
> X = np.tile(\_section_xy_sequence\[:, 0\], (n_z, 1))
>
> Y = np.tile(\_section_xy_sequence\[:, 1\], (n_z, 1))
>
> Z = np.vstack(\[np.full(n_points, section_z_min), np.full(n_points, section_z_max)\])
>
> \# --- Step 2: Create structured grid (rectangular surface)
>
> surf = pv.StructuredGrid(X, Y, Z)
>
> \# --- Step 3: Define texture coordinates ---
>
> \# u varies along the section (0 to 1)
>
> \# v varies vertically (0 to 1)
>
> u = np.linspace(0, 1, n_points)
>
> v = np.linspace(0, 1, n_z)
>
> uu, vv = np.meshgrid(u, v)
>
> \# Flatten in the same order as the structured grid’s points
>
> uv = np.c\_\[uu.flatten(order="F"), vv.flatten(order="F")\]
>
> \# Embed the texture coordinates
>
> surf.active_texture_coordinates = uv
>
> return surf
>
> ```
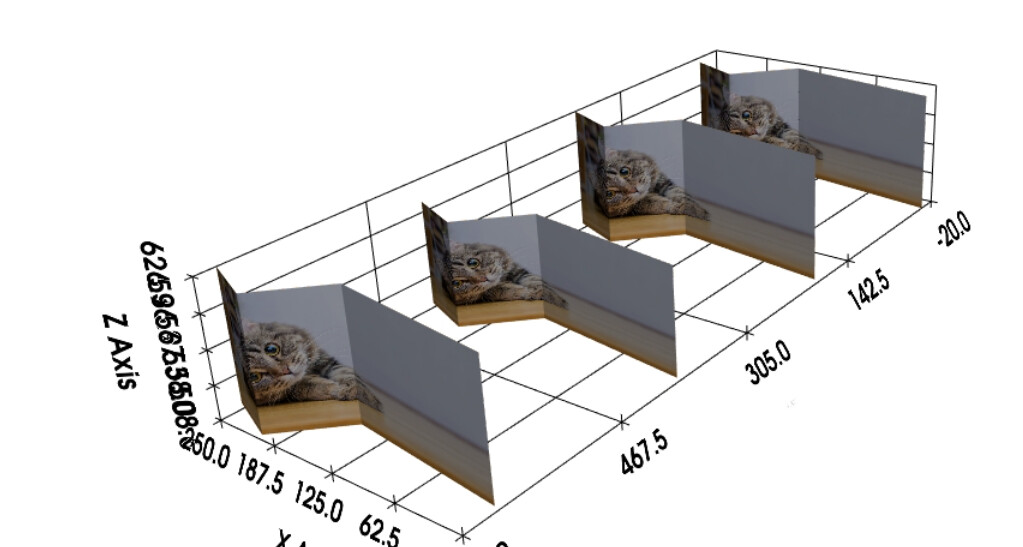
Here is an example where I plot 4 cross sections. Everything works like a charm with pyvista:
> # Test
>
> image\_path = “kitty.jpg”
>
> xy = np.array([[0.0, 0.0], [150.0, -20], [200, 30.0], [250, 10.0]])
>
> xy\_seq = [
>
> ```auto
> xy,
>
> xy + np.array(\[0.0, 200.0\]),
>
> xy + np.array(\[0.0, 400.0\]),
>
> xy + np.array(\[0.0, 600.0\]),
>
> ```
>
> ]
>
> z\_min\_seq = [508.6, 513.6, 512.7, 513.6]
>
> z\_max\_seq = [621.3, 626.3, 606.3, 626.3]
>
> texture = pv.read\_texture(image\_path)
>
> plotter = pv.Plotter()
>
> for i, (section\_xy\_sequence, section\_z\_min, section\_z\_max) in enumerate(zip(
>
> ```auto
> xy_seq, z_min_seq, z_max_seq
>
> ```
>
> )):
>
> ```auto
> \# Make the cross section
>
> cross_section_surf = make_cross_section_surface(
>
> section_xy_sequence, section_z_min, section_z_max
>
> )
>
> \# save the image
>
> cross_section_surf.save(Path(image_path).stem + f"\_{i}.vts")
>
> \# Add to the plotter
>
> plotter.add_mesh(cross_section_surf, texture=texture)
>
> ```
>
> plotter.show\_grid()
>
> plotter.show()
This is what you have:
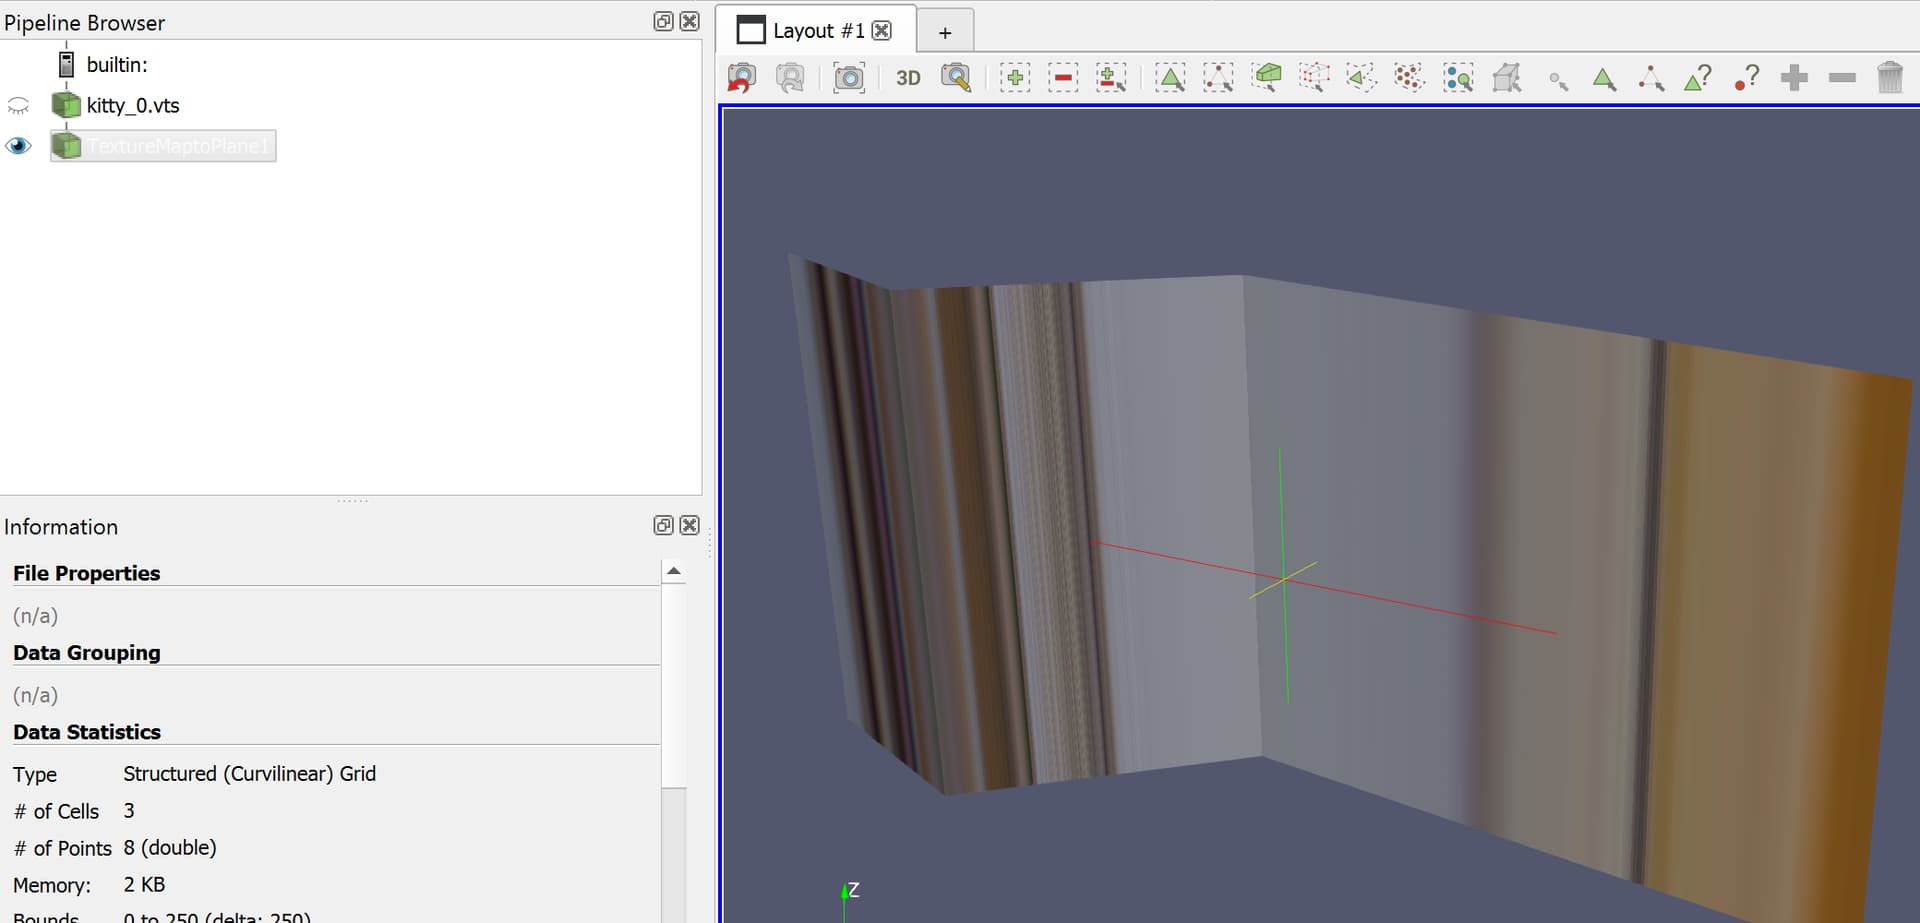
Now when I try to load the \*.vts in Paraview and use the textureMaptoPlane filter, things got messed up:
Theoretically, it should work fine because the texture coordinates are embedded in the vts…
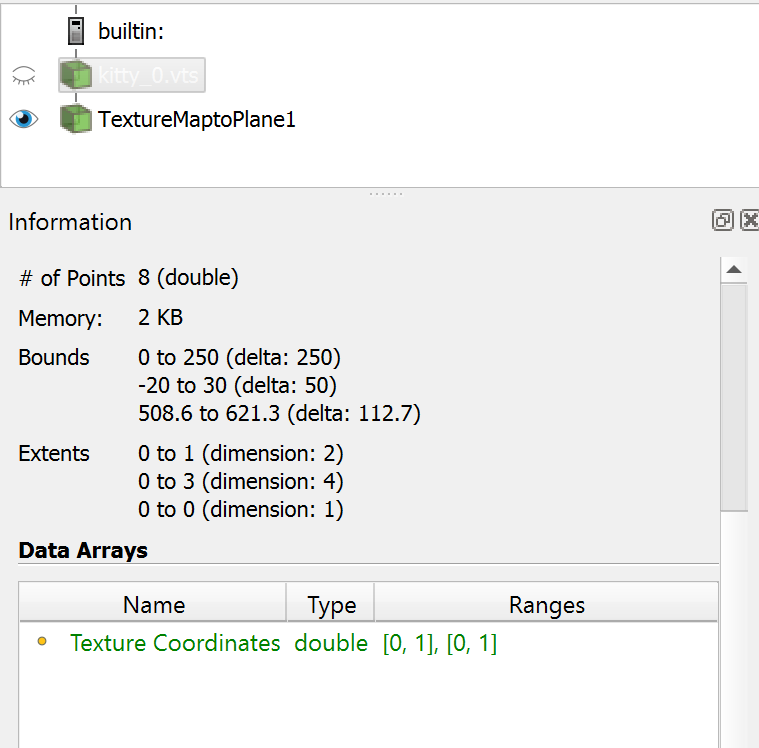
Still, it seems that I have to play with the properties:
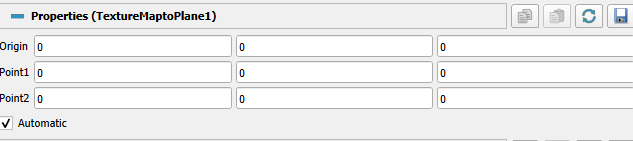
So two questions:
- Why does the “automatic” mode messes up ?
- How should I fill Point1 and Point2 in my case ?
I looked for more than one hour on the web and did not found the answer….
Thank you in advance for the help.
Antoine COLLET
---
### Author:  [@cory.quammen](https://discourse.paraview.org/u/cory.quammen)
#### Post date: [October 27, 2025, 9:42am UTC](https://discourse.paraview.org/t/help-with-filter-texturemaptoplane/17261/2 "2025-10-27T09:42:54Z")
Welcome to the ParaView community, @antoinecollet5 !
> [@antoinecollet5](#):
>
> Theoretically, it should work fine because the texture coordinates are embedded in the vts…
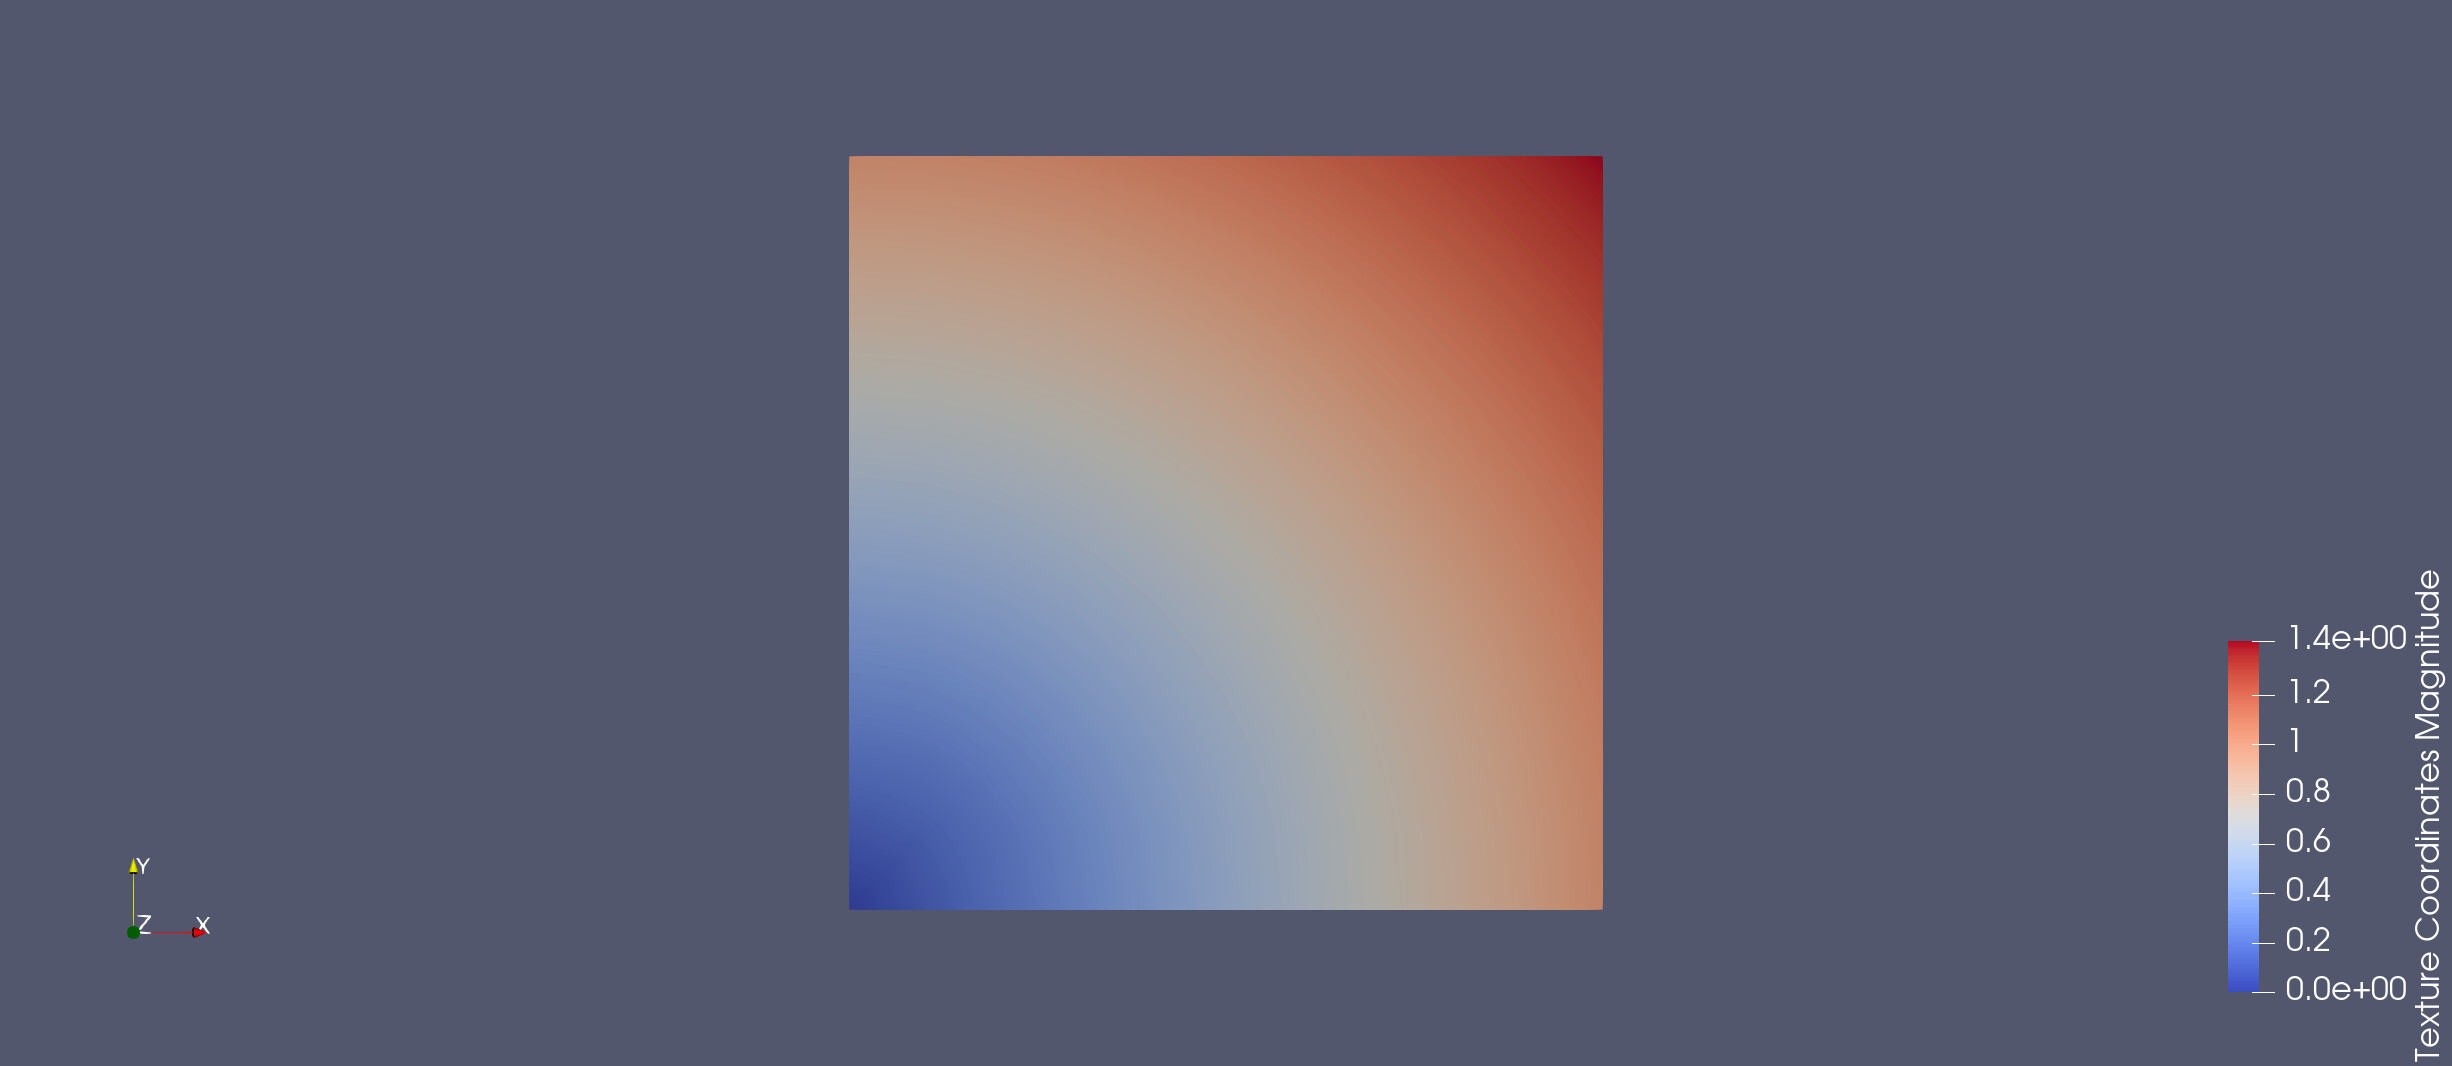
If you already have the texture coordinates in the .vts file, then I’m confused why you are using the **Texture Map to Plane** filter in ParaView. To verify that you have the texture coordinates in the .vts file, could you color by the “Texture Coordinates” data array? You should see something like
If you are trying to reproduce the texture coordinate calculation in ParaView, then your pipeline looks fine. Trying the **Texture Map to Plane** filter with planes oriented in XY, YZ, and XZ directions with **Automatic** set on, it looks like it works fine. Could you share an example of a .vts file to aid debugging?
---
### Author:  [@antoinecollet5](https://discourse.paraview.org/u/antoinecollet5)
#### Post date: [October 27, 2025, 10:08am UTC](https://discourse.paraview.org/t/help-with-filter-texturemaptoplane/17261/3 "2025-10-27T10:08:23Z")
Indeed @[cory.quammen](https://discourse.paraview.org/u/cory.quammen), this is what I obtain:
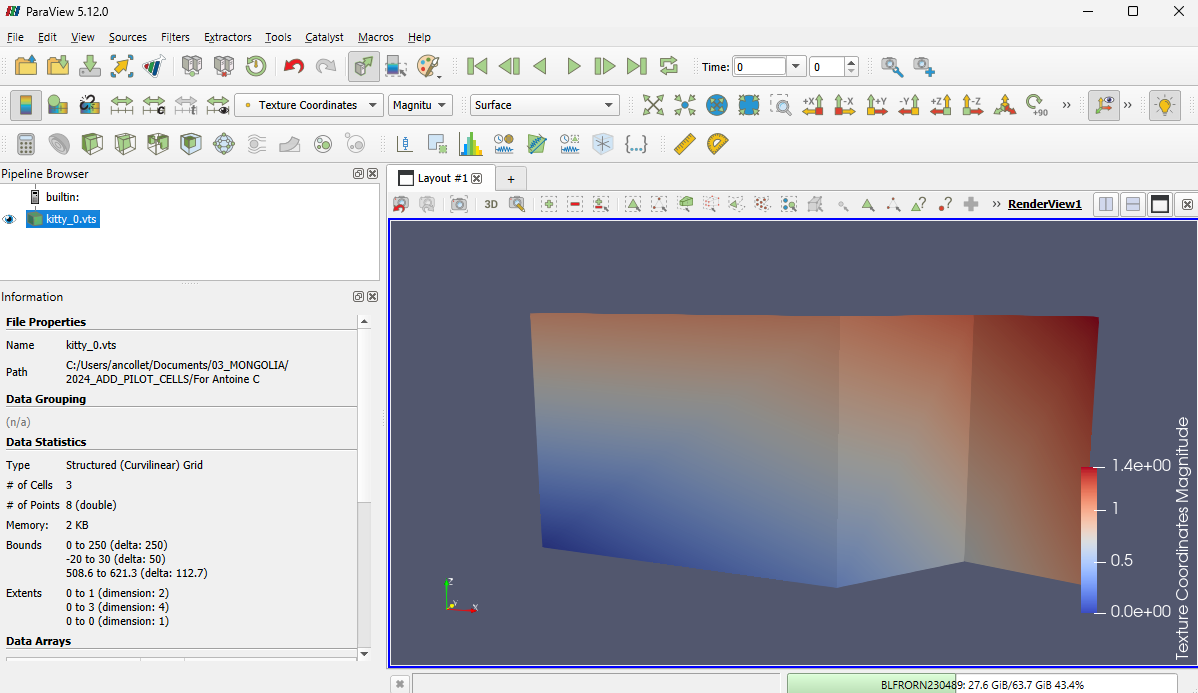
My bad… I did not see that I can directly apply a texture (no filter). Then it works fine… I did not look deep enough in the properties before going to the filter approach.