# Hide outline when using volume representation
**URL:** https://discourse.paraview.org/t/hide-outline-when-using-volume-representation/17314
**Category:** ParaView Support
**Created:** [November 17, 2025, 4:17pm UTC](https://discourse.paraview.org/t/hide-outline-when-using-volume-representation/17314 "2025-11-17T16:17:37Z")
**Posts on this page:** 8
**Page:** 1
### Author:  [@akilandrews](https://discourse.paraview.org/u/akilandrews)
#### Post date: [November 17, 2025, 4:17pm UTC](https://discourse.paraview.org/t/hide-outline-when-using-volume-representation/17314/1 "2025-11-17T16:17:37Z")
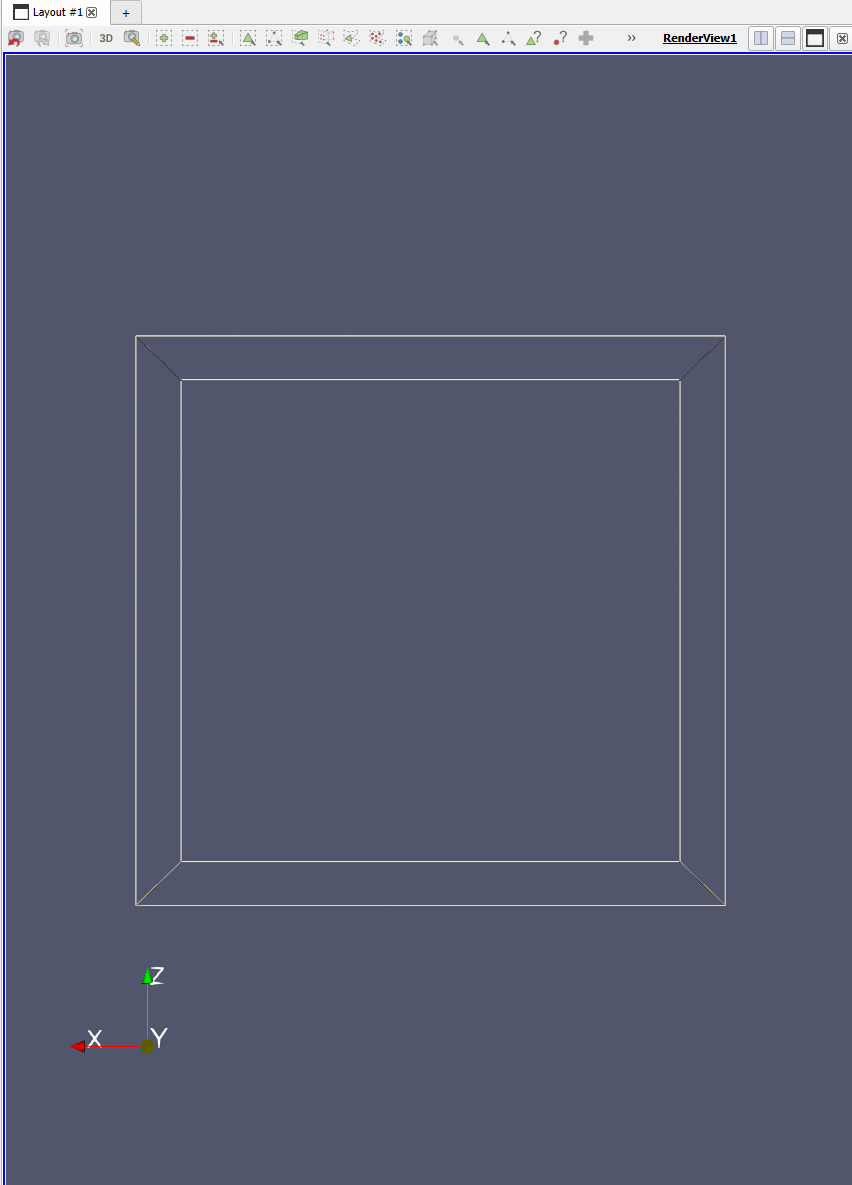
When I load my .pvti data files the default representation is Outline. I then select my data array and switch to Volume representation. The outline remains and a horizontal and vertical bar also appear. How to hide the outline and bars?

---
### Author:  [@mwestphal](https://discourse.paraview.org/u/mwestphal)
#### Post date: [November 17, 2025, 4:22pm UTC](https://discourse.paraview.org/t/hide-outline-when-using-volume-representation/17314/2 "2025-11-17T16:22:55Z")
please share your data (and a statsfile) if possible.
---
### Author:  [@akilandrews](https://discourse.paraview.org/u/akilandrews)
#### Post date: [November 17, 2025, 4:29pm UTC](https://discourse.paraview.org/t/hide-outline-when-using-volume-representation/17314/3 "2025-11-17T16:29:07Z")
Here is a link to the data it is \> 10MB. How to generate a stats file? [https://drive.google.com/file/d/1OHwkrkqLnfWcouMlz6qJM3aGIRFRb-V1/view?usp=sharing](https://drive.google.com/file/d/1OHwkrkqLnfWcouMlz6qJM3aGIRFRb-V1/view?usp=sharing)
---
### Author:  [@mwestphal](https://discourse.paraview.org/u/mwestphal)
#### Post date: [November 17, 2025, 4:52pm UTC](https://discourse.paraview.org/t/hide-outline-when-using-volume-representation/17314/4 "2025-11-17T16:52:15Z")
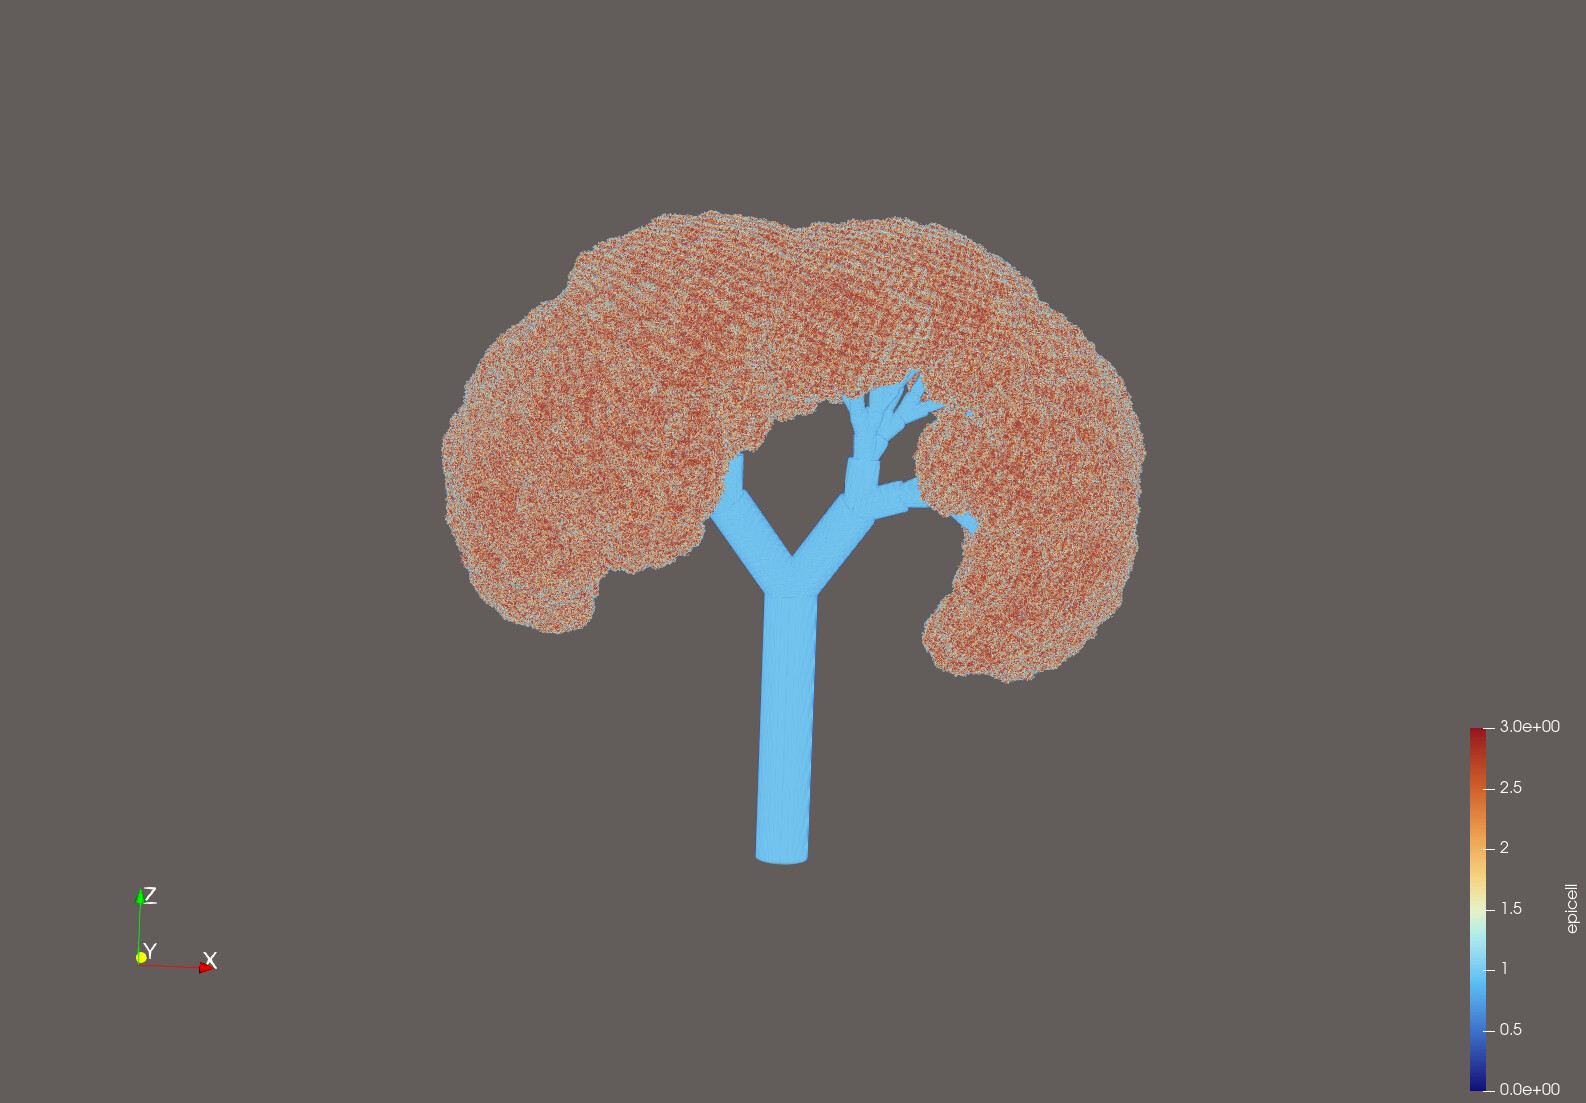
Works fine here:
> How to generate a statE file?
File → SaveState
---
### Author:  [@akilandrews](https://discourse.paraview.org/u/akilandrews)
#### Post date: [November 17, 2025, 7:37pm UTC](https://discourse.paraview.org/t/hide-outline-when-using-volume-representation/17314/5 "2025-11-17T19:37:18Z")
That visualization is what I am seeking. Here is the state file. I am using ParaView 5.11.1 and connecting to remote server (Rocky Linux, Intel Zeon CPU, Nvidia A100 GPUs) using ‘mpiexec -np 64 pvserver --mpi --force-offscreen-rendering --server-port=11111’ due the size of the data and client side using a Surface Book 3 laptop with Intel Graphics. Which version of ParaView did you use to display?
[model.pvsm](https://discourse.paraview.org/uploads/short-url/dcZ98U5uLql7eeZ99R1sIQGYdAu.pvsm) (211.6 KB)
---
### Author:  [@mwestphal](https://discourse.paraview.org/u/mwestphal)
#### Post date: [November 18, 2025, 8:29am UTC](https://discourse.paraview.org/t/hide-outline-when-using-volume-representation/17314/6 "2025-11-18T08:29:56Z")
> [@akilandrews](#):
>
> Which version of ParaView did you use to display?
ParaView 6.0.1 Linux Binary release.
Your state file works fine here, please update ParaView.
---
### Author:  [@otaolafr](https://discourse.paraview.org/u/otaolafr)
#### Post date: [November 18, 2025, 8:45am UTC](https://discourse.paraview.org/t/hide-outline-when-using-volume-representation/17314/7 "2025-11-18T08:45:44Z")
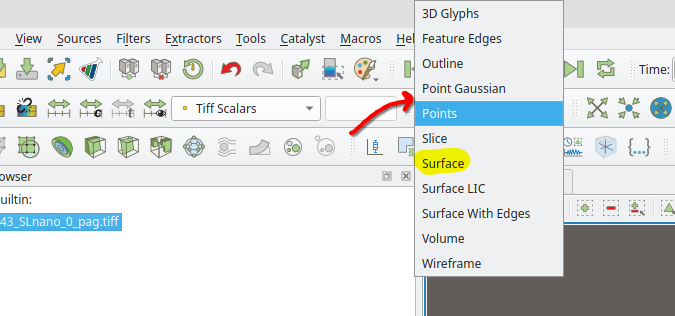
@akilandrews i think it is simply that your visual style of the filter it becomes outline and therefore you see this, try to change it to surface and maybe it solves it?
---
### Author:  [@akilandrews](https://discourse.paraview.org/u/akilandrews)
#### Post date: [March 9, 2026, 7:45pm UTC](https://discourse.paraview.org/t/hide-outline-when-using-volume-representation/17314/8 "2026-03-09T19:45:03Z")
Thanks for the suggestions and sorry for the late reply. I have a ~374e6 size grid with 84% sparsity. Using version 5.11.1 the axis and bounding box appear when I expand “Display” dialog in “Properties” tab. Once the box/grid appears sometimes I cannot hide it by collapsing the “Display” dialog “-”. And when box/grid is hidden the image has a thin line down center axis than can be lessened by increasing the “Light Scale” value in the “View” dialog. Thats when I discovered how to remove box/grid completely as it is somehow tied to ray tracing. I was also able to completely toggle the appearance of the box/grid by checking/un-checking “Enable Ray Tracing” in the “View” dialog under “Ray Traced Rendering”.