# Histogram and colormap
**URL:** https://discourse.paraview.org/t/histogram-and-colormap/6314
**Category:** ParaView Support
**Created:** [January 27, 2021, 5:37pm UTC](https://discourse.paraview.org/t/histogram-and-colormap/6314 "2021-01-27T17:37:51Z")
**Posts on this page:** 2
**Page:** 1
### Author:  [@Maugan\_S](https://discourse.paraview.org/u/Maugan_S)
#### Post date: [January 27, 2021, 5:37pm UTC](https://discourse.paraview.org/t/histogram-and-colormap/6314/1 "2021-01-27T17:37:51Z")
Hi, i wanted to know if if possible to get the colormap on the histogram like that
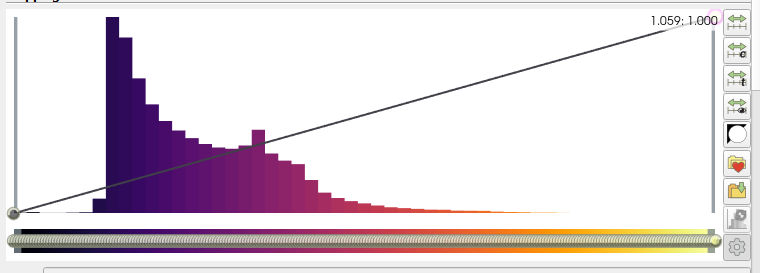
But on the histogram filter that shows the differents axis : 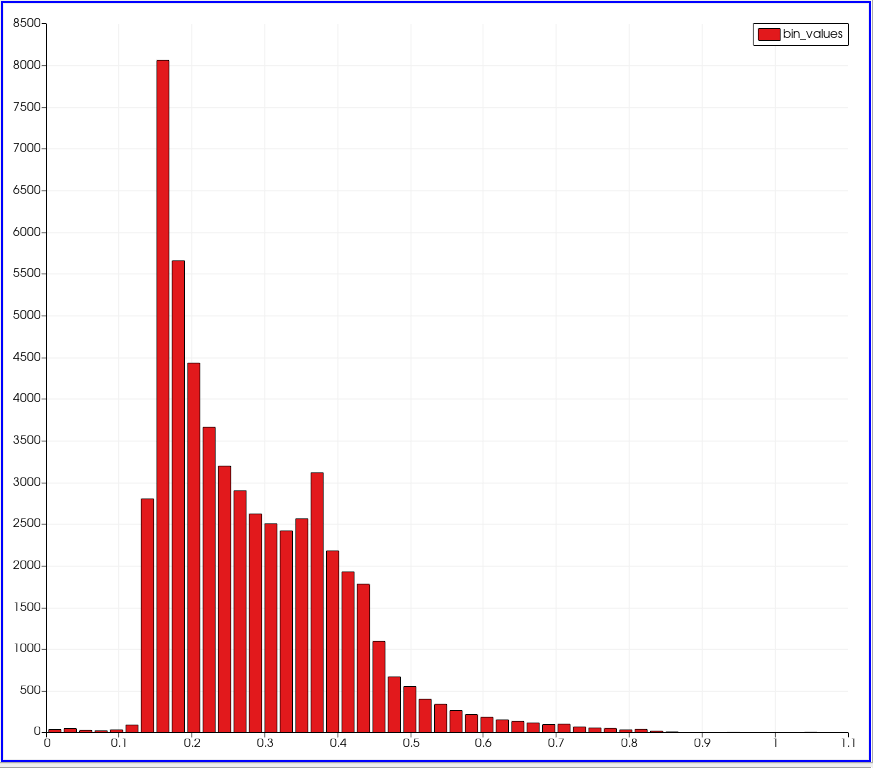
And if not, is it possible to export the first histogram (the colored one ) to a csv file ?
Thank you!
---
### Author:  [@mwestphal](https://discourse.paraview.org/u/mwestphal)
#### Post date: [January 28, 2021, 11:13am UTC](https://discourse.paraview.org/t/histogram-and-colormap/6314/2 "2021-01-28T11:13:48Z")
Your two histogram look identical, I’m not sure were you see a difference.