# histogram: can we get an estimate volume per bin value?
**URL:** https://discourse.paraview.org/t/histogram-can-we-get-an-estimate-volume-per-bin-value/9563
**Category:** ParaView Support
**Created:** [May 4, 2022, 2:46pm UTC](https://discourse.paraview.org/t/histogram-can-we-get-an-estimate-volume-per-bin-value/9563 "2022-05-04T14:46:34Z")
**Posts on this page:** 3
**Page:** 1
### Author:  [@Trophime](https://discourse.paraview.org/u/Trophime)
#### Post date: [May 4, 2022, 2:46pm UTC](https://discourse.paraview.org/t/histogram-can-we-get-an-estimate-volume-per-bin-value/9563/1 "2022-05-04T14:46:35Z")
Hi,
I would like to have a kind of histogram that display the distribution of data by the “percentage of the total volume” occupied by isovalues? For cell data, for instance, I would like to know in how much of the total volume the data is approximatively A.
Thanks for any suggestions
Best
PS: by the way, could someone explain what are bin\_extends/bin\_values?
---
### Author:  [@Kenneth\_Moreland](https://discourse.paraview.org/u/Kenneth_Moreland)
#### Post date: [May 4, 2022, 8:05pm UTC](https://discourse.paraview.org/t/histogram-can-we-get-an-estimate-volume-per-bin-value/9563/2 "2022-05-04T20:05:44Z")
I think the following sequence of steps will get what you want.
1. Calculate the volume of each cell. You can use the `Cell Size` filter to do that. It will create a cell field named `Volume` that represents the volume of each cell.
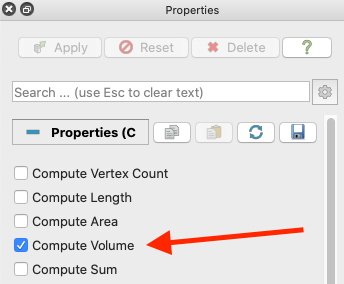
The `Mesh Quality` filter can do something similar.
2. Add the `Histogram` filter. After selecting the input array and bin count, turn on the advanced options . Turn on the option for `Calculate Averages`. (It will calculate totals, too, which is what you want.)
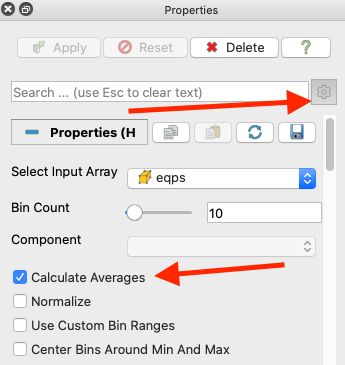
3. Once you apply the `Histogram` filter, you will see the bar chart now has several bars of different color for every bin. This is giving you, for each field, the average and summed value of data points that are in that bin. All you really want is the total volume for each bin. Scroll down the `Properties` panel until you get the table labeled `Series Parameters`. Turn off all series except the one named `Volume_total`.
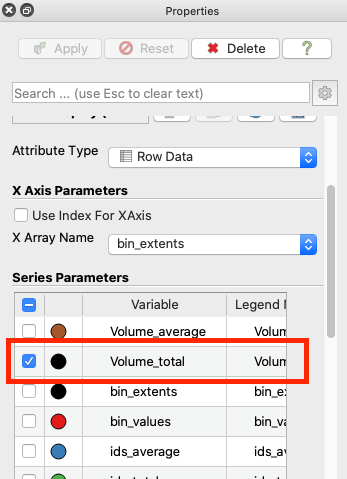
As for the question about `bin_extents` and `bin_values`, I forget the details, but they capture the bins of the histogram. `bin_extents` is capturing both the min and max value for each bin. In the histogram, you are not just finding for each bin i all field values that equal x\_i. You are finding all values in the range from x\_i to x\_{i+1}. `bin_extents` is just capturing that range. If I recall, it is recording the center of the bin and some assumptions are made about the range by the bar chart view. The `bin_values` are just the computed value for each bin (i.e., the count).
---
### Author:  [@Trophime](https://discourse.paraview.org/u/Trophime)
#### Post date: [June 1, 2022, 12:47pm UTC](https://discourse.paraview.org/t/histogram-can-we-get-an-estimate-volume-per-bin-value/9563/3 "2022-06-01T12:47:14Z")
@Kenneth_Moreland Thanks for your answer.
I still have a question. Is it possible to save the histogram as a csv data file?