# Horizontal stripes show on solid surface in Q criterion contour
**URL:** https://discourse.paraview.org/t/horizontal-stripes-show-on-solid-surface-in-q-criterion-contour/15092
**Category:** ParaView Support
**Created:** [July 21, 2024, 7:48am UTC](https://discourse.paraview.org/t/horizontal-stripes-show-on-solid-surface-in-q-criterion-contour/15092 "2024-07-21T07:48:56Z")
**Posts on this page:** 10
**Page:** 1
### Author:  [@cheapmeow](https://discourse.paraview.org/u/cheapmeow)
#### Post date: [July 21, 2024, 7:48am UTC](https://discourse.paraview.org/t/horizontal-stripes-show-on-solid-surface-in-q-criterion-contour/15092/1 "2024-07-21T07:48:56Z")
My flow past airfoil case shows horizontal stripes on airfoil surface in Q criterion contour.
The result is calculated by custom solver, using incompressible model, DNS algorithm, structured grid, immersive boundary method to handle coupling of solid.
Result pvts file is:
[https://drive.google.com/file/d/1Zdzt3uCRv8VVBwxit0KD2P9sgPypuDqV/view?usp=sharing](https://drive.google.com/file/d/1Zdzt3uCRv8VVBwxit0KD2P9sgPypuDqV/view?usp=sharing)
The q criterion image:
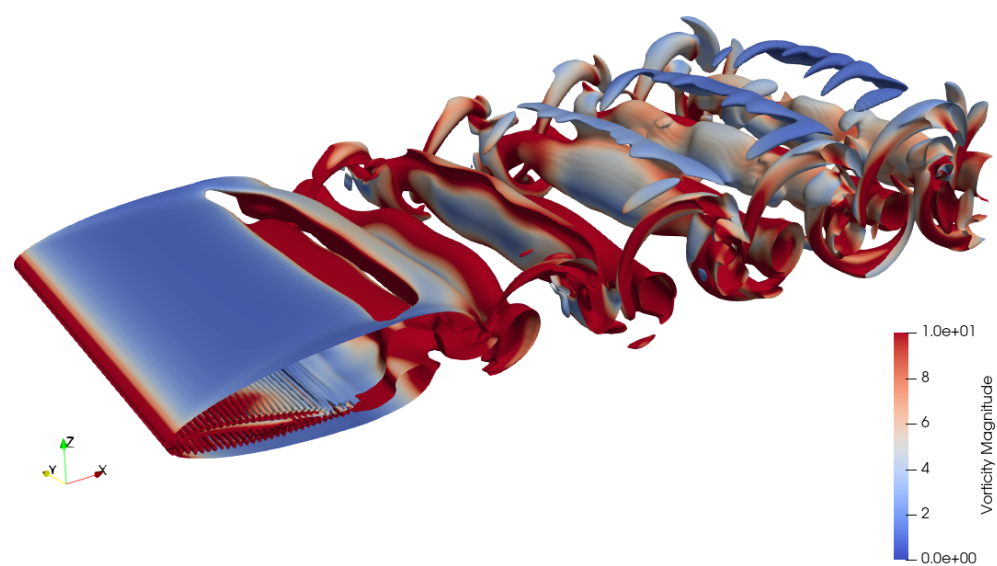
You can see obvious horizontal stripes on airfoil surface.
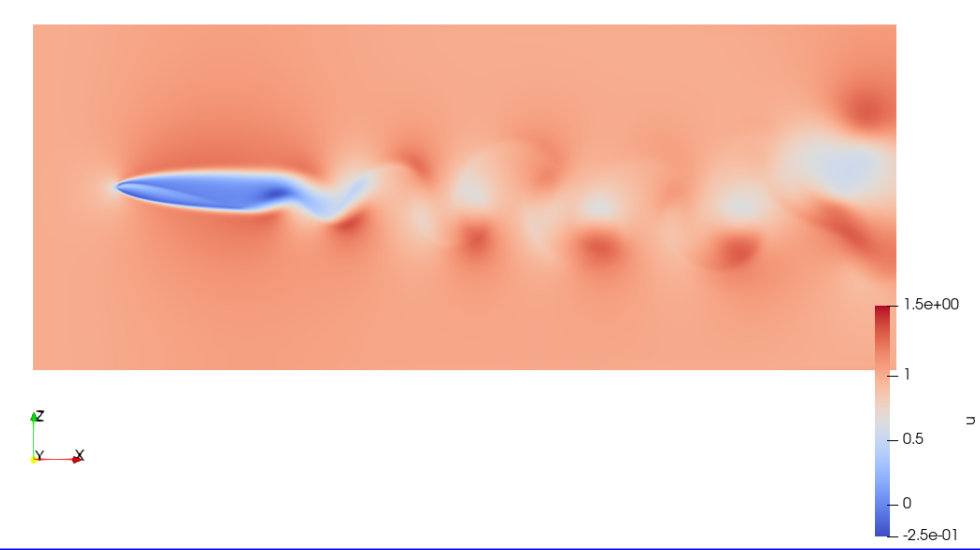
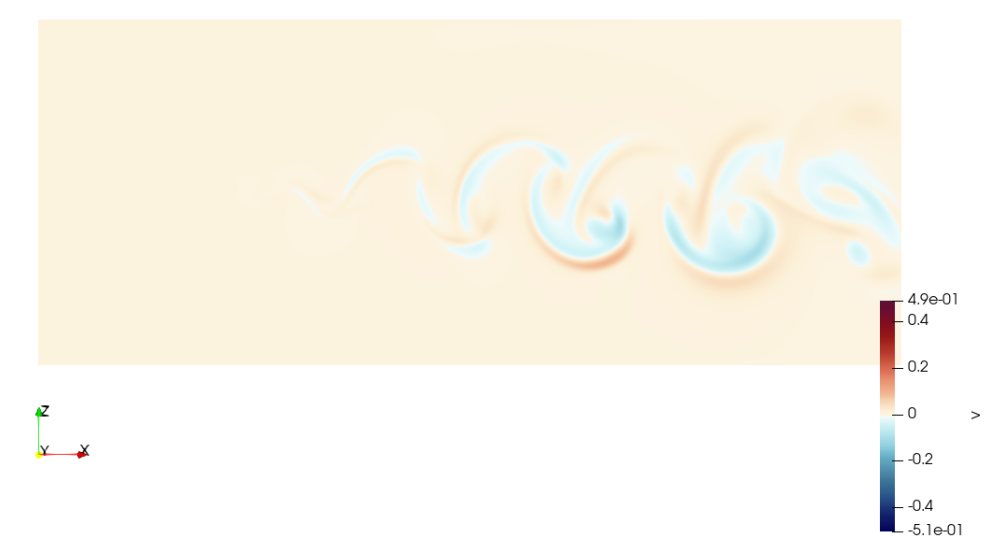
I have checked the velocity on section of fluid by `resample to image`.
U section:
V section:
W section:
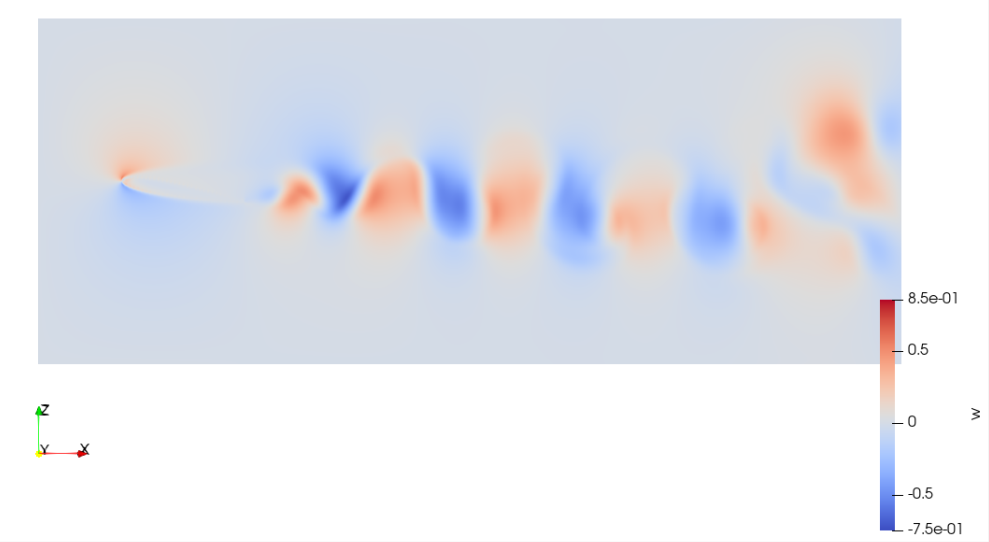
All of three velocity components looks like smooth, it confused me. I don’t know why there is oscillation in Q criterion?
Thank you for your reply.
---
### Author:  [@cory.quammen](https://discourse.paraview.org/u/cory.quammen)
#### Post date: [July 22, 2024, 2:17pm UTC](https://discourse.paraview.org/t/horizontal-stripes-show-on-solid-surface-in-q-criterion-contour/15092/2 "2024-07-22T14:17:09Z")
Thanks for providing the dataset. My usual laptop couldn’t uncompress it for some reason, so I couldn’t have a look at the data.
Is the velocity magnitude on the airfoil 0? I wonder if that and perhaps the discretization around of the wing are causing the issue you are seeing.
---
### Author:  [@cheapmeow](https://discourse.paraview.org/u/cheapmeow)
#### Post date: [July 23, 2024, 10:35am UTC](https://discourse.paraview.org/t/horizontal-stripes-show-on-solid-surface-in-q-criterion-contour/15092/3 "2024-07-23T10:35:07Z")
Yes, the velocity magnitude on airfoil surface is 0. It is draw by `Resample to image` slice.
Maybe discretization method in `Resample to image` and `Contour` are not the same?
---
### Author:  [@cory.quammen](https://discourse.paraview.org/u/cory.quammen)
#### Post date: [July 23, 2024, 11:19am UTC](https://discourse.paraview.org/t/horizontal-stripes-show-on-solid-surface-in-q-criterion-contour/15092/4 "2024-07-23T11:19:05Z")
> [@cheapmeow](#):
>
> It is draw by `Resample to image` slice.
I’m not sure I follow. Where do you use **Resample to Image**? Could you share a screenshot of your pipeline?
---
### Author:  [@cheapmeow](https://discourse.paraview.org/u/cheapmeow)
#### Post date: [July 27, 2024, 3:37am UTC](https://discourse.paraview.org/t/horizontal-stripes-show-on-solid-surface-in-q-criterion-contour/15092/5 "2024-07-27T03:37:34Z")
I am sorry, I am outside of school, so I can’t ssh to vncserver in school server, even though I have connected to vpn. So I can’t provide you a screenshot.
More specifically, I use `Resample to Image` to draw velocity section. I use `NVIDIA IndeX` plugin as `representation` of `Resample to Image`, take `Velocity_X`, `Velocity_Y`, `Velocity_Z` as the value to be resampled. And I use `NVIDIA IndeX` slice to show the section.
---
### Author:  [@cory.quammen](https://discourse.paraview.org/u/cory.quammen)
#### Post date: [July 27, 2024, 1:34pm UTC](https://discourse.paraview.org/t/horizontal-stripes-show-on-solid-surface-in-q-criterion-contour/15092/6 "2024-07-27T13:34:34Z")
Thanks for explaining your pipeline. The **Resample to Image** sampling pattern is introducing aliasing of your velocity field. Some points of the resampling grid fall inside the wing, where presumably the velocity is set to 0, and some are out in the volume outside the wing, so have real values. That sharp transition across grid cell is probably what you are seeing along the wing.
IndeX is supposed to be able to render unstructured grids. It must not be available for your input structured grid. You could apply a **Tetrahedralize** filter to your input at the cost of a lot more memory use and try to render it with the IndeX representation. That might not be the best solution, but should at least prevent the resampling artifacts you are seeing.
---
### Author:  [@Kenichiro-Yoshimi](https://discourse.paraview.org/u/Kenichiro-Yoshimi)
#### Post date: [July 28, 2024, 10:59am UTC](https://discourse.paraview.org/t/horizontal-stripes-show-on-solid-surface-in-q-criterion-contour/15092/7 "2024-07-28T10:59:56Z")
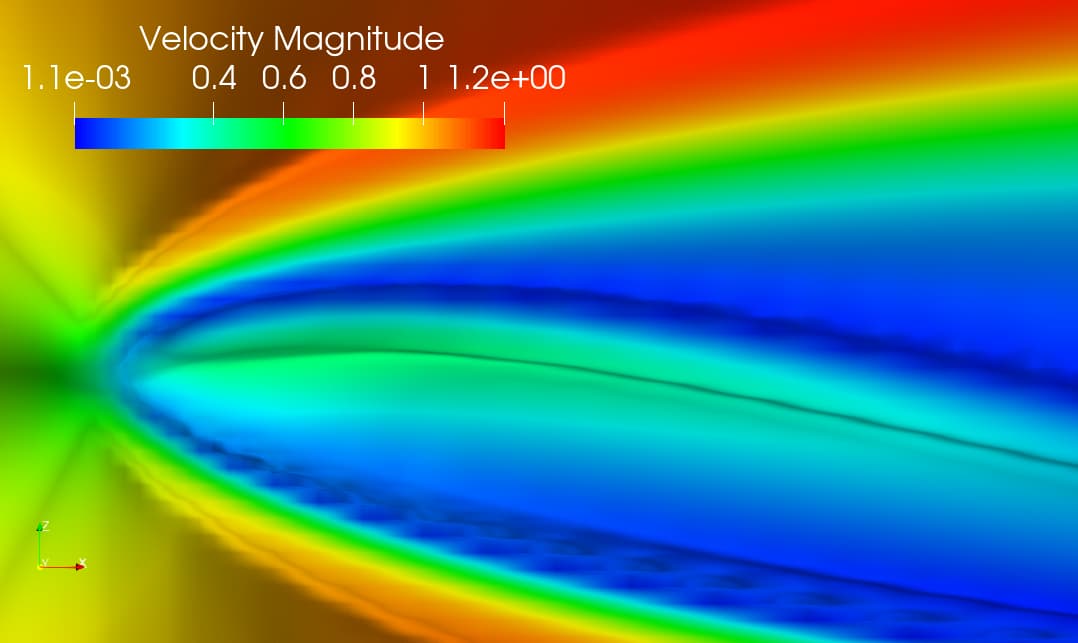
You mention that the velocity field is smooth. However, in the immersed boundary method, the wing surface shape is represented as a staircase. This effect may cause the velocity vector field to appear wobbly when displayed with shadows in volume rendering.
---
### Author:  [@cheapmeow](https://discourse.paraview.org/u/cheapmeow)
#### Post date: [August 2, 2024, 7:36am UTC](https://discourse.paraview.org/t/horizontal-stripes-show-on-solid-surface-in-q-criterion-contour/15092/9 "2024-08-02T07:36:03Z")
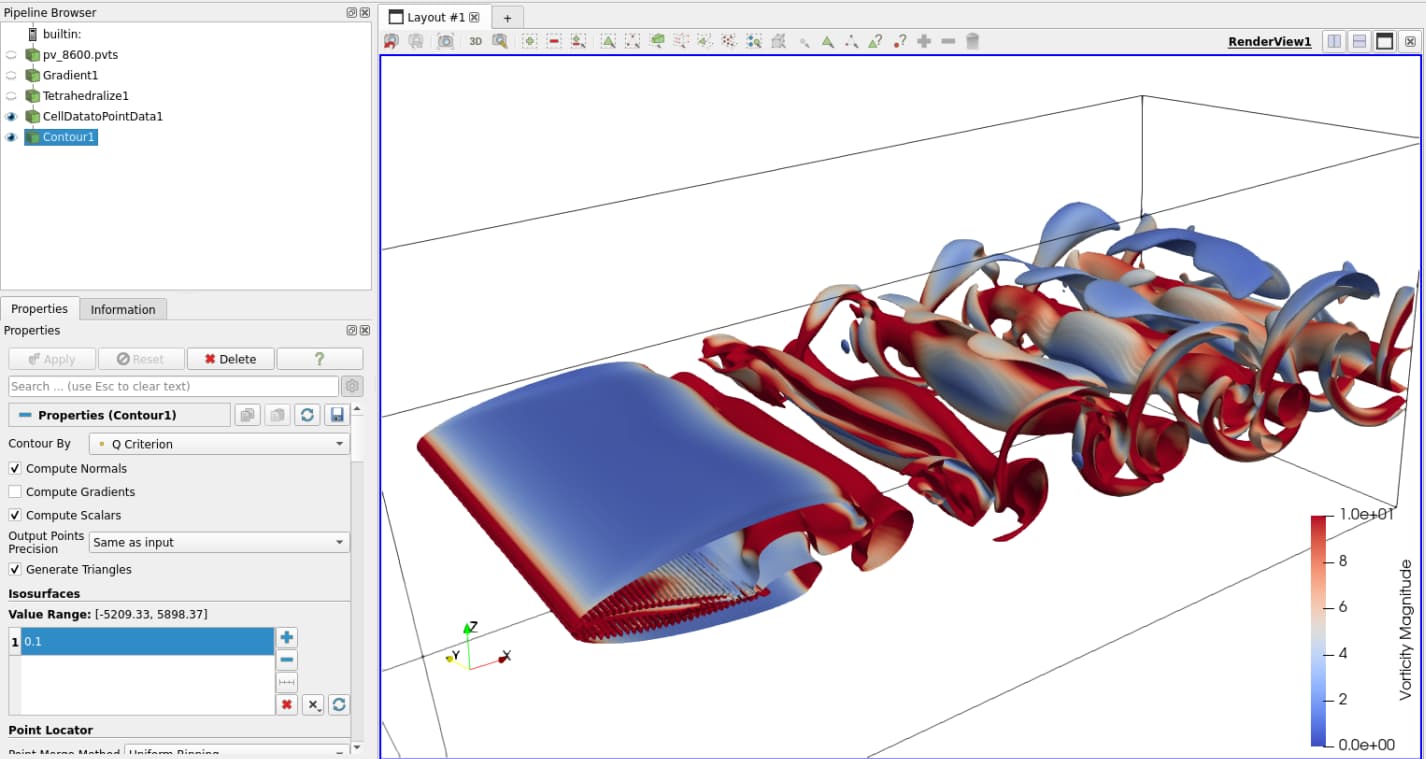
`Tetrahedralize` doesn’t help.
---
### Author:  [@cheapmeow](https://discourse.paraview.org/u/cheapmeow)
#### Post date: [August 2, 2024, 7:41am UTC](https://discourse.paraview.org/t/horizontal-stripes-show-on-solid-surface-in-q-criterion-contour/15092/10 "2024-08-02T07:41:11Z")
I have tried two method of generating IBM points, one is simply repeating along y axis, the other is repeating along y axis with staggered offset.
Figure 1: simply repeating along y axis.
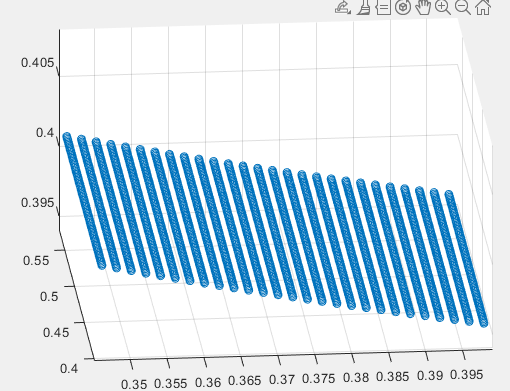
Figure 2: repeating along y axis with staggered offset.
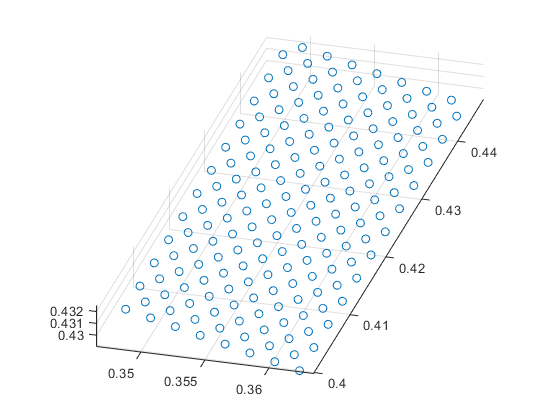
Both methods produce same stripes problem.
Both methods are not staircase. Points are sampled at NACA0012 fitting function.
Fitting function comes from:
[https://turbmodels.larc.nasa.gov/naca0012\_val.html](https://turbmodels.larc.nasa.gov/naca0012_val.html)
---
### Author:  [@cheapmeow](https://discourse.paraview.org/u/cheapmeow)
#### Post date: [August 2, 2024, 8:05am UTC](https://discourse.paraview.org/t/horizontal-stripes-show-on-solid-surface-in-q-criterion-contour/15092/11 "2024-08-02T08:05:22Z")
You are right, I can also see the staircase of velocity magnitude, but I don’t know why.