# how can i change the axis of plot
**URL:** https://discourse.paraview.org/t/how-can-i-change-the-axis-of-plot/14151
**Category:** ParaView Support
**Created:** [March 14, 2024, 8:48am UTC](https://discourse.paraview.org/t/how-can-i-change-the-axis-of-plot/14151 "2024-03-14T08:48:12Z")
**Posts on this page:** 5
**Page:** 1
### Author:  [@Chhotelal](https://discourse.paraview.org/u/Chhotelal)
#### Post date: [March 14, 2024, 8:48am UTC](https://discourse.paraview.org/t/how-can-i-change-the-axis-of-plot/14151/1 "2024-03-14T08:48:12Z")
Dear Expert,
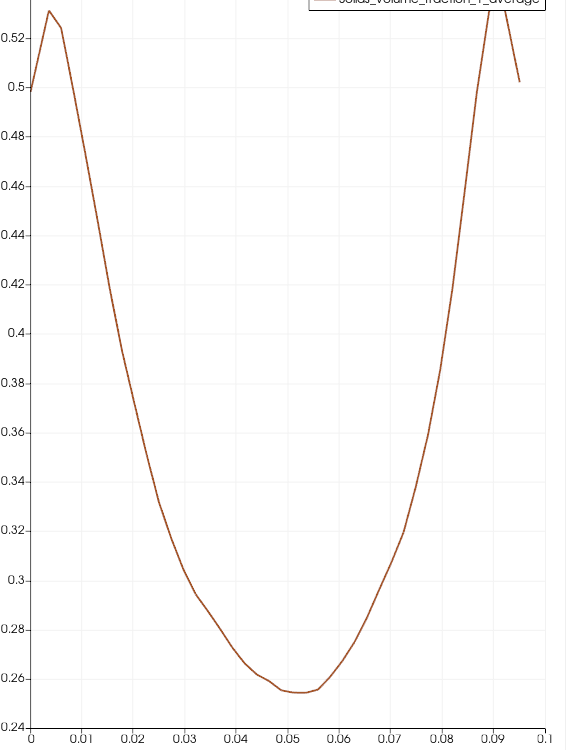
I want to change the axis range from -1 to 1 while the current axis is 0 to 1, when I change my bottom custom axis from -1 to 1 plot was shiting and not showing the same plot with the custom axis, could you help me to figure out.
---
### Author:  [@mwestphal](https://discourse.paraview.org/u/mwestphal)
#### Post date: [March 14, 2024, 3:16pm UTC](https://discourse.paraview.org/t/how-can-i-change-the-axis-of-plot/14151/2 "2024-03-14T15:16:40Z")
Hi @Chhotelal
You can find all the control for custom axes on the properties panel.
Please experiment with it and let us know what is working or not for you.
Best,
---
### Author:  [@Chhotelal](https://discourse.paraview.org/u/Chhotelal)
#### Post date: [March 15, 2024, 1:21pm UTC](https://discourse.paraview.org/t/how-can-i-change-the-axis-of-plot/14151/3 "2024-03-15T13:21:05Z")
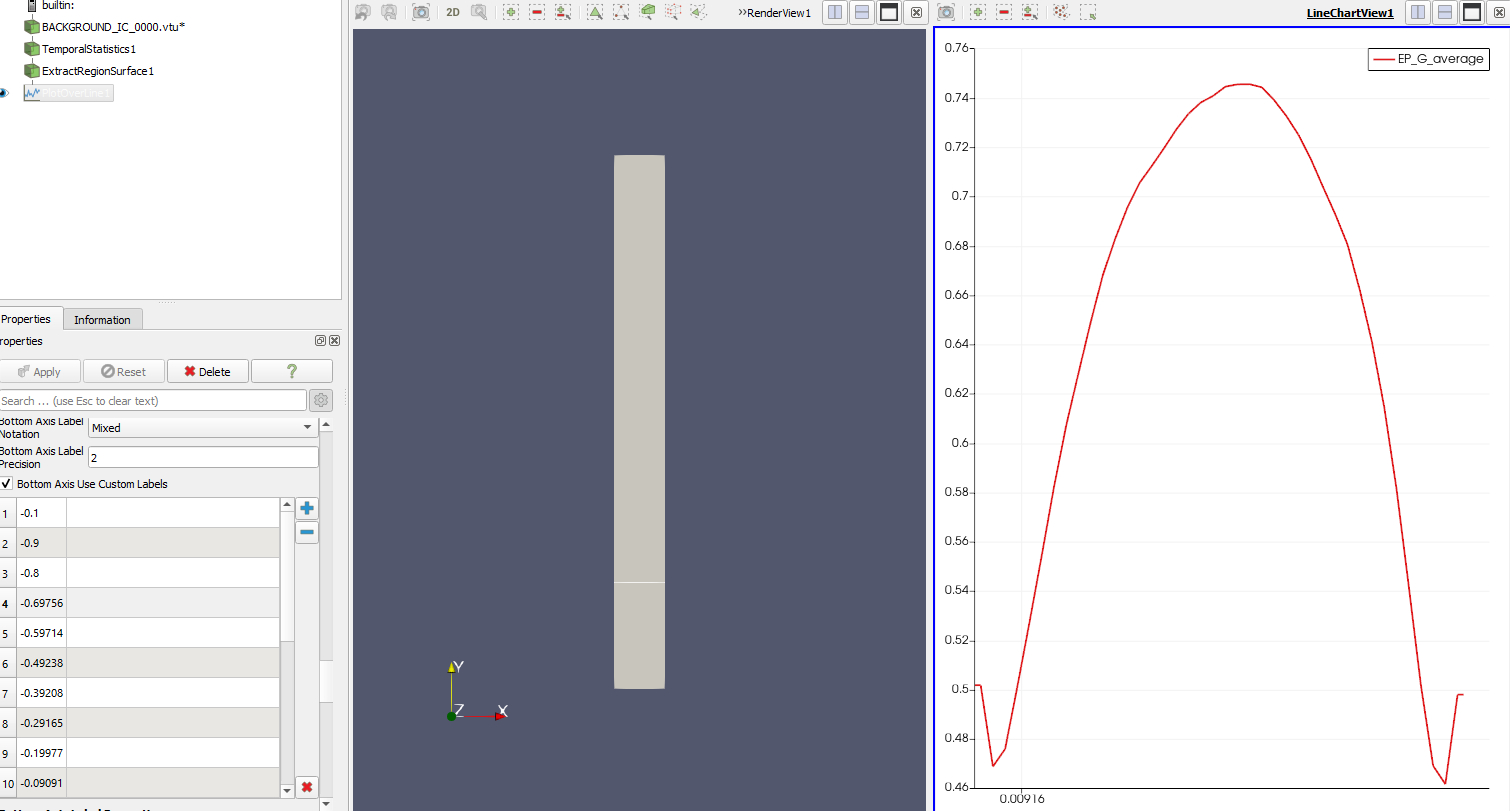
@mwestphal, I tried but the bottom axis is not converting, you can look it up below.
My geometry size is 0 to 0.095
---
### Author:  [@Kenneth\_Moreland](https://discourse.paraview.org/u/Kenneth_Moreland)
#### Post date: [March 18, 2024, 2:59pm UTC](https://discourse.paraview.org/t/how-can-i-change-the-axis-of-plot/14151/4 "2024-03-18T14:59:52Z")
@Chhotelal I think we are confused about what you are asking. These Q&A tend to be easier when you provide data and instructions on how to reproduce what you are seeing in addition to a description of what you want to see.
If I understand your question, it sounds like you want to rescale the numbers on the X-axis without actually rescaling the curve of the plot. Put another way, you want to arbitrarily write numbers in the X-axis that might not have any relevance to the data being plotted.
In short, ParaView won’t let you do that. If it writes a number on the X-axis, it will only place that to correspond to that location in the plot. If you want to change the scale, you will have to either rescale the data or add a field of the appropriate scale to use for the X locations in the plot.
Based on the screenshot you gave, probably the easiest way to do this is to use the `Transform` filter before the `Plot Over Line` filter. To rescale the X bounds from [0,0.095] to [-1, 1], set the `Scale` to [21.05,1,1] (where 21.05 \approx 2/0.095) and set the `Translate` to [-1,0,0].
---
### Author:  [@Chhotelal](https://discourse.paraview.org/u/Chhotelal)
#### Post date: [March 19, 2024, 2:07pm UTC](https://discourse.paraview.org/t/how-can-i-change-the-axis-of-plot/14151/5 "2024-03-19T14:07:32Z")
@Kenneth_Moreland , Thank you for your reply, but this is not changing, could you check it.
[BACKGROUND\_IC\_0021.vtu](https://discourse.paraview.org/uploads/short-url/i5pY96SzGAYXwSmSPKTLeum7iLa.vtu) (567.5 KB)
I want to plot Epg at x=(0,0.15) , y = (0.2, 0.2)
while x-axis rescale to write (-1 to 1).