# How can i draw .txt data written in meshgrid format.
**URL:** https://discourse.paraview.org/t/how-can-i-draw-txt-data-written-in-meshgrid-format/10027
**Category:** ParaView Support
**Created:** [July 17, 2022, 4:49pm UTC](https://discourse.paraview.org/t/how-can-i-draw-txt-data-written-in-meshgrid-format/10027 "2022-07-17T16:49:41Z")
**Posts on this page:** 3
**Page:** 1
### Author:  [@ali1](https://discourse.paraview.org/u/ali1)
#### Post date: [July 17, 2022, 4:49pm UTC](https://discourse.paraview.org/t/how-can-i-draw-txt-data-written-in-meshgrid-format/10027/1 "2022-07-17T16:49:41Z")
Hi,
How can i draw .txt data written in meshgrid format. in matlab i used to draw it as following
[Ux.txt](https://discourse.paraview.org/uploads/short-url/bzU769R31qNo0O331NJ5rTCAebT.txt) (231.6 KB)
thanks.
a=1:1:72;
b=1:1:71;
[A, B]=meshgrid(a,b);
contourf(A,B,data’,30);
---
### Author:  [@mwestphal](https://discourse.paraview.org/u/mwestphal)
#### Post date: [July 19, 2022, 11:19am UTC](https://discourse.paraview.org/t/how-can-i-draw-txt-data-written-in-meshgrid-format/10027/2 "2022-07-19T11:19:31Z")
How is your data formatted ? It only contains numbers.
---
### Author:  [@Kenichiro-Yoshimi](https://discourse.paraview.org/u/Kenichiro-Yoshimi)
#### Post date: [July 19, 2022, 1:09pm UTC](https://discourse.paraview.org/t/how-can-i-draw-txt-data-written-in-meshgrid-format/10027/3 "2022-07-19T13:09:47Z")
Hello,
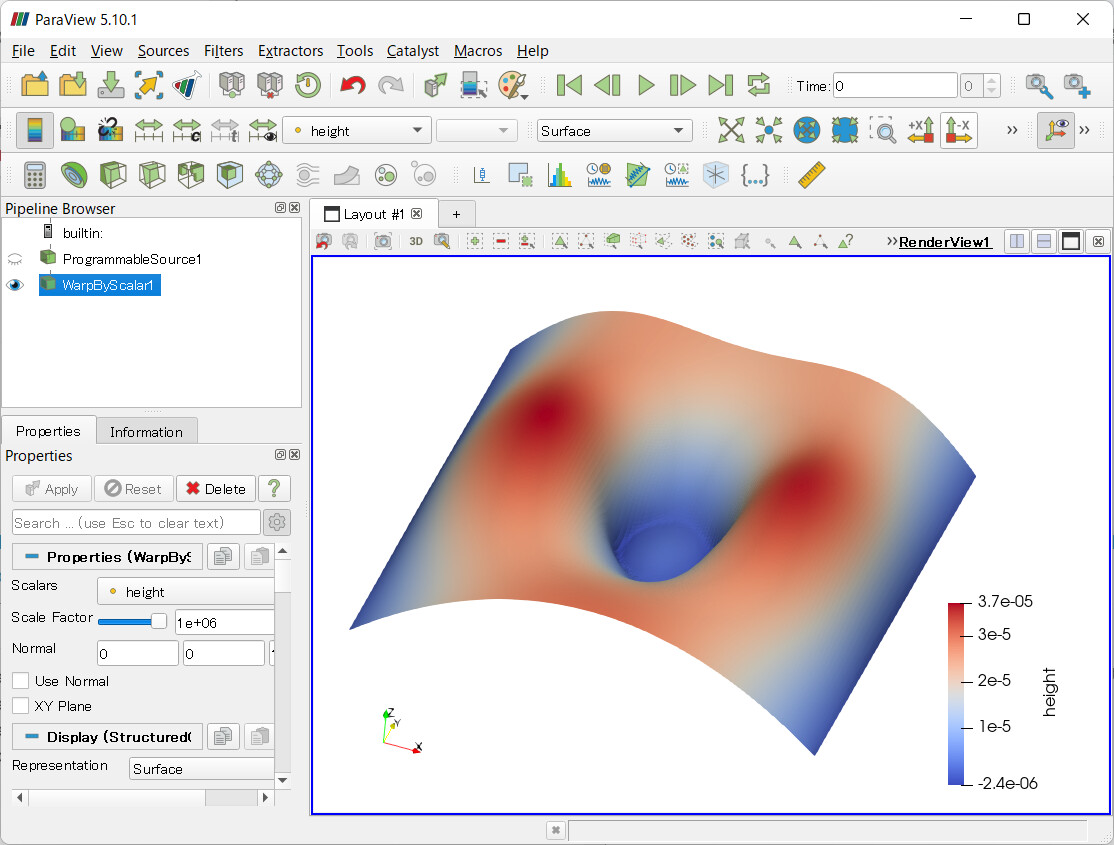
I was able to load it in the same way as the link below.
> [@CSV table data to 3D](https://discourse.paraview.org/t/csv-table-data-to-3d/7858/4):
>
> One way to achieve this is to use a Programmable Source. Source \> Alphabetical \> Programmable Source Fill in the Script (RequestInformation) as shown below. from paraview import util util.SetOutputWholeExtent(self, [0, 98, 0, 37, 0, 0]) Here, the values to be specified for SetOutputWholeExtent are obtained by counting the number of rows and columns from the csv file in advance. Enter the following in Script. import numpy as np path = 'data\_path/Sample.csv' a = np.loadtxt(path, delimiter=…
Now you need to modify the `Script (RequestInformation)` and `Script` in the **Programmable Source** Filter.
- `Script (RequestInformation)`
```python
from paraview import util
util.SetOutputWholeExtent(self, [0, 140, 0, 141, 0, 0])
```
- `Script`
```python
import numpy as np
path = 'your_data_path/Ux.txt'
a = np.loadtxt(path, encoding='utf-8_sig').flatten()
output.SetDimensions(141, 142, 1)
output.SetOrigin(0.0, 0.0, 0.0)
output.SetSpacing(1, 1, 1)
output.PointData.append(a, 'height')
```