# How can I visualize multiple discontinuous data in Paraview?
**URL:** https://discourse.paraview.org/t/how-can-i-visualize-multiple-discontinuous-data-in-paraview/9028
**Category:** ParaView Support
**Created:** [February 21, 2022, 7:33pm UTC](https://discourse.paraview.org/t/how-can-i-visualize-multiple-discontinuous-data-in-paraview/9028 "2022-02-21T19:33:46Z")
**Posts on this page:** 3
**Page:** 1
### Author:  [@zipengxu456](https://discourse.paraview.org/u/zipengxu456)
#### Post date: [February 21, 2022, 7:33pm UTC](https://discourse.paraview.org/t/how-can-i-visualize-multiple-discontinuous-data-in-paraview/9028/1 "2022-02-21T19:33:47Z")
Hello,
I’m new user for Paraview. Currently, I’m using the paraview to visualize my research project’s microstructure, by using the threshold, I can visualize the structure I want. I also showed the threshold setting below.
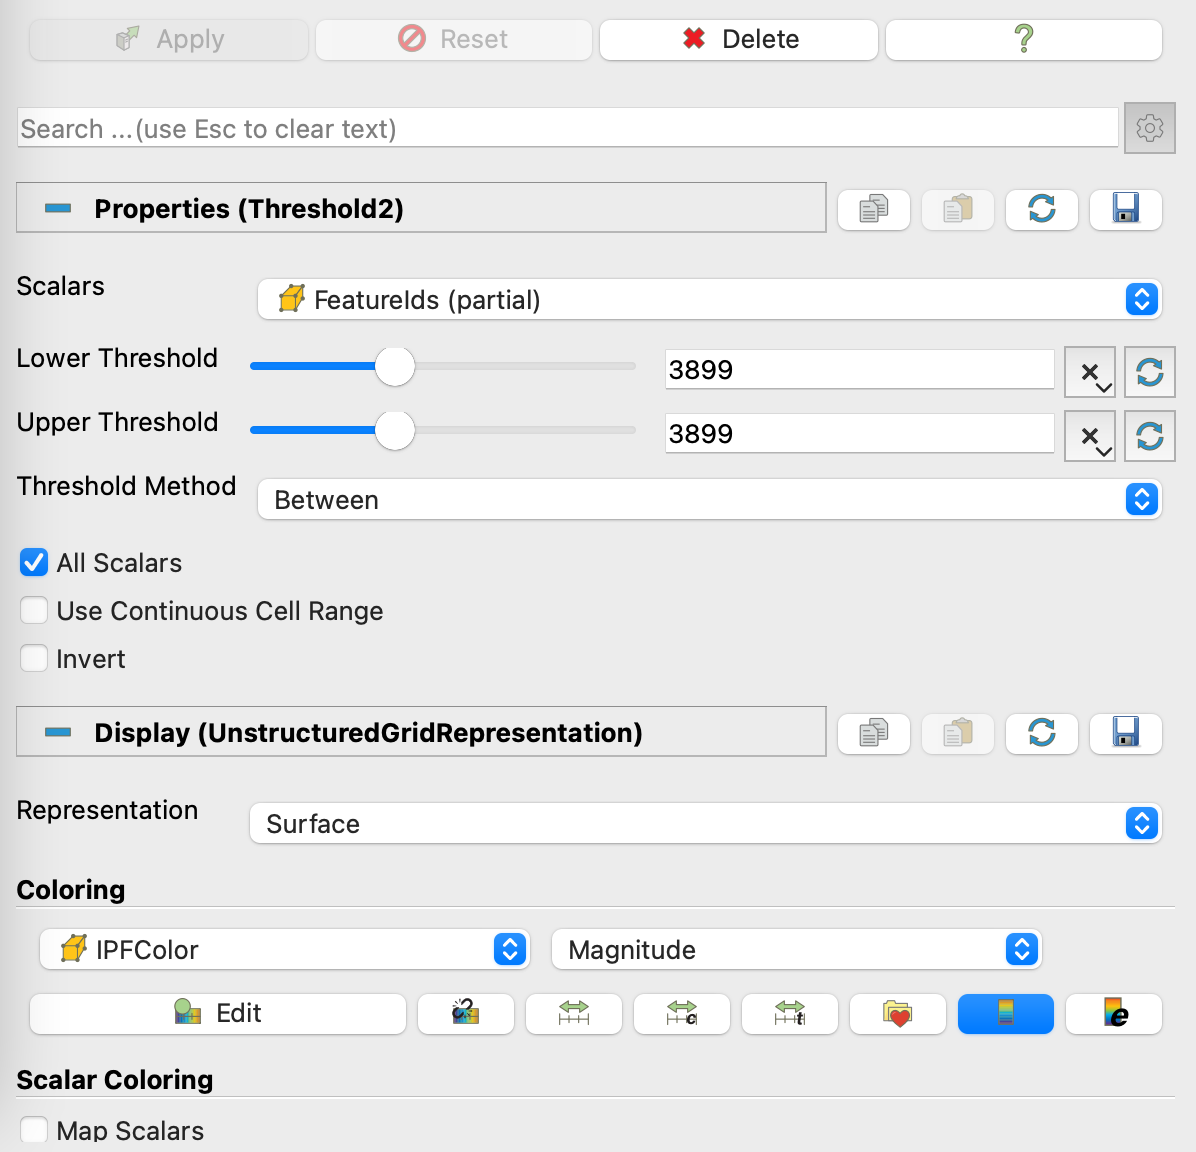
I know how to use the threshold to visualize the individual stuff by using its unique ID (in this case FeatureID), or visualize a continuous set of stuff by setting the range of the ID value. However, how can I visualize some stuff that don’t have a continuous list of IDs? For example, if I have a .csv file that contains some IDs like 12, 16, 199, 1000, etc. Do I have a chance to visualize them all at once without manually put thresholds for each individual IDs?
Best,
Zipeng(Perry) Xu
---
### Author:  [@Christos\_Tsolakis](https://discourse.paraview.org/u/Christos_Tsolakis)
#### Post date: [February 21, 2022, 7:59pm UTC](https://discourse.paraview.org/t/how-can-i-visualize-multiple-discontinuous-data-in-paraview/9028/2 "2022-02-21T19:59:53Z")
> some IDs like 12, 16, 199, 1000, etc. Do I have a chance to visualize them all at once without manually put thresholds for each individual IDs?
You can use the [Find](https://docs.paraview.org/en/latest/UsersGuide/selectingData.html#creating-selections-using-the-find-data-panel) dialog and use the `is one of` operator.
---
### Author:  [@zipengxu456](https://discourse.paraview.org/u/zipengxu456)
#### Post date: [February 21, 2022, 8:13pm UTC](https://discourse.paraview.org/t/how-can-i-visualize-multiple-discontinuous-data-in-paraview/9028/3 "2022-02-21T20:13:53Z")
Thank you very much! It works!